Tire Safety and Blowout Statistics 2026
50+ tire safety statistics for 2026: 78,000+ tire-related crashes a year, blowout and underinflation data, aging, and state-by-state breakdowns.
Tire Safety & Blowout Statistics 2026: 50+ Stats on Crashes, Injuries & Prevention
Last updated: May 2026 · Reviewed annually
Tire failures cause more than 78,000 crashes, 10,000 injuries, and 400 deaths on U.S. roads every year — and the most recent NHTSA data shows the death count climbing. Yet most tire-related crashes are preventable: 69% of vehicles drive with at least one underinflated tire, only 19% of consumers maintain proper pressure, and four out of every five tire-aging claims involve tires older than six years. Whether you're a driver, an attorney, a fleet manager, a journalist, or a safety researcher, this page compiles the most important tire safety and blowout statistics in one place — all sourced and cited. This in-depth report is part of our Tire Industry Statistics 2026 series — a 50+-stat overview of the entire U.S. tire industry.
Key Findings
- 78,392 crashes per year in the U.S. due to flat tires or blowouts (NHTSA, DOT HS 811 617).
- 10,275 injuries and 414 fatalities per year from tire failures — and 2024 NHTSA data shows 511 tire-related deaths.
- 69% of vehicles have at least one underinflated tire per a Rubber Manufacturers Association survey.
- Only 19% of consumers properly inflate their tires and only 42% check pressure regularly.
- 3× crash risk for tires underinflated 25% or more — and 70%+ of blowouts happen at highway speeds above 50 mph.
- 45% rollover rate for SUVs in tire-related crashes — substantially higher than passenger cars.
- 2,821 OOS tire violations at 2024 CVSA Roadcheck — 20.8% of all out-of-service violations, second only to brakes.
- 84% of tire-aging claims involve tires older than 6 years per NHTSA's foundational tire-aging research.
📑 Table of Contents
- Tire-Related Crash & Fatality Statistics
- Tire Blowout Statistics
- Flat Tire Statistics
- Tire Underinflation & Pressure Statistics
- Tire Tread Wear & Aging Statistics
- Vehicle-Specific Safety Statistics
- Tire Safety by State
- Tire Recall Statistics (2020–2025)
- Prevention, TPMS & Driver Behavior
- Frequently Asked Questions
- Methodology & Sources
Tire-Related Crash & Fatality Statistics
Tire failures remain a significant factor in motor vehicle crashes. The NHTSA Tire-Related Factors in the Pre-Crash Phase study (DOT HS 811 617) remains the most-cited compilation of tire crash data and is updated against newer NHTSA Fatality Analysis Reporting System (FARS) figures each year.
- 78,392 crashes occur annually in the U.S. due to flat tires or blowouts.
- 10,275 non-fatal injuries per year result from tire-related crashes.
- 414 fatalities per year are attributed to flat tires or blowouts in the foundational NHTSA study.
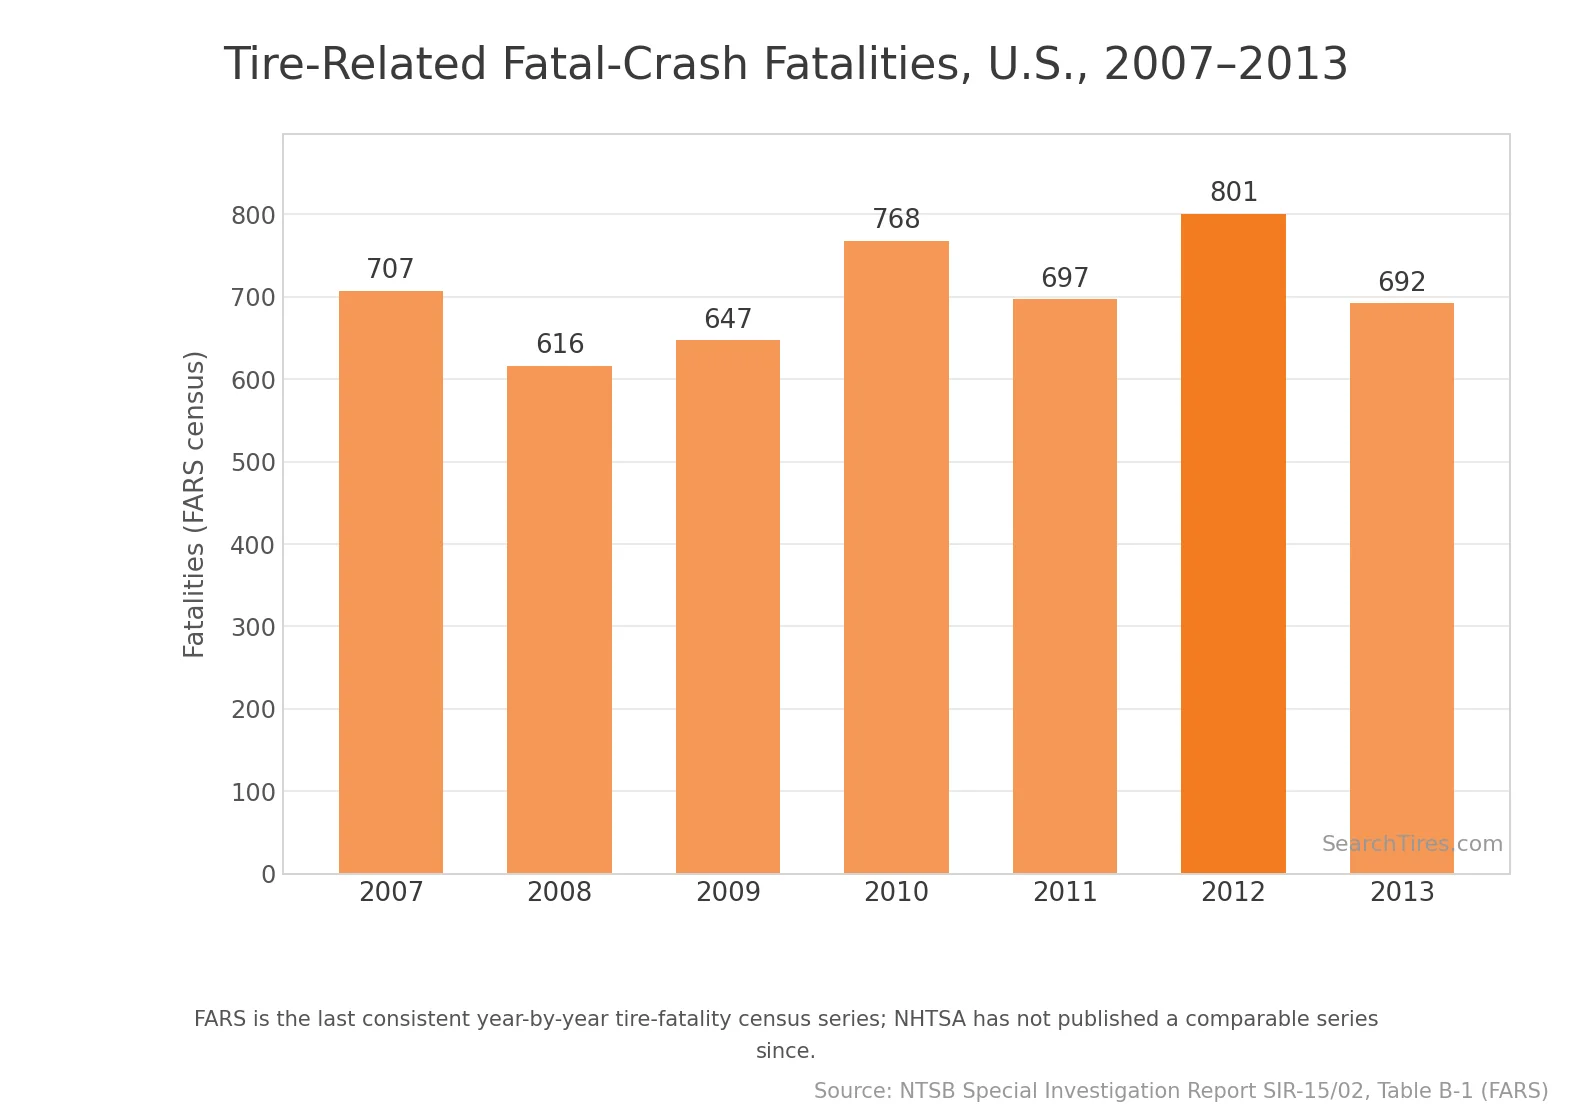
- 511 people died on U.S. roads in tire-related crashes in 2024 — the most recent NHTSA tire-related fatality estimate.
- 738 fatalities occurred on U.S. roads from tire-related crashes in 2017, illustrating year-over-year variability.
- 9% of crashes involve a vehicle with pre-crash tire problems per the National Motor Vehicle Crash Causation Survey.
- A tire is 3× more likely to be a critical pre-crash factor when it is underinflated by more than 25% of recommended pressure.
- Vehicles older than 10 years have the highest rate of pre-crash tire problems — older vehicles disproportionately experience tire failure.
Tire Blowout Statistics
Tire blowouts — sudden, complete loss of tire pressure caused by structural failure — are the most violent category of tire failure and carry the highest rollover and fatality risk. Blowouts are concentrated in summer months and at highway speeds.
- Industry analyses of NHTSA crash data estimate that tire blowouts contribute to approximately 11,000 crashes annually in the United States, a subset of the broader 78,000+ tire-failure total.
- The majority of tire blowouts occur at highway speeds above 50 mph, with failure risk rising as driver speed approaches 75 mph — the upper bound of most U.S. interstate speed limits.
- Tire blowout incidents concentrate in May through October, when higher ambient temperatures, fully loaded vehicles, and long-distance summer travel converge.
- Industry technical references commonly cite ~195°F as the threshold where tire compound integrity begins to degrade, with structural failure risk rising significantly above 250°F — temperatures readily reached on hot pavement with an underinflated, fully loaded tire.
- Underinflation by more than 25% is a leading precursor to catastrophic blowouts in passenger vehicles, causing severe sidewall flexion and heat buildup.
- For commercial vehicles, tire and wheel failure is one of three critical vehicle-related factors in serious large-truck crashes — alongside braking capacity and cargo shift — per the FMCSA Large Truck Crash Causation Study. Brake problems were coded as the most frequent vehicle factor at 29% of trucks; tire problems were coded for 6%.
Flat Tire Statistics
Flat tires — slow leaks, punctures, and partial deflations — are far more common than catastrophic blowouts but carry significantly lower fatality risk. The flat-tire failure mode is dominated by punctures and underinflation rather than structural collapse.
- AAA responds to several million flat-tire roadside calls per year across the United States, consistently among the top three roadside emergencies alongside dead batteries and lockouts.
- An estimated 200 million flat tires occur in the U.S. annually, including both roadside flats and at-home discoveries.
- The average U.S. driver will experience approximately 5 flat tires in their lifetime.
- 41% of U.S. drivers reported experiencing a flat tire or blowout in the previous 12 months.
- Only 10% of new vehicles come equipped with a full-size spare tire — the rest carry temporary spares, run-flat tires, sealant kits, or no spare at all.
Tire Underinflation & Pressure Statistics
Tire underinflation is the single most common precursor to tire-related crashes, blowouts, and roadside breakdowns. It also costs U.S. drivers billions in unnecessary fuel and tire wear annually.
- 69% of vehicles on the road have at least one underinflated tire, per a Rubber Manufacturers Association survey.
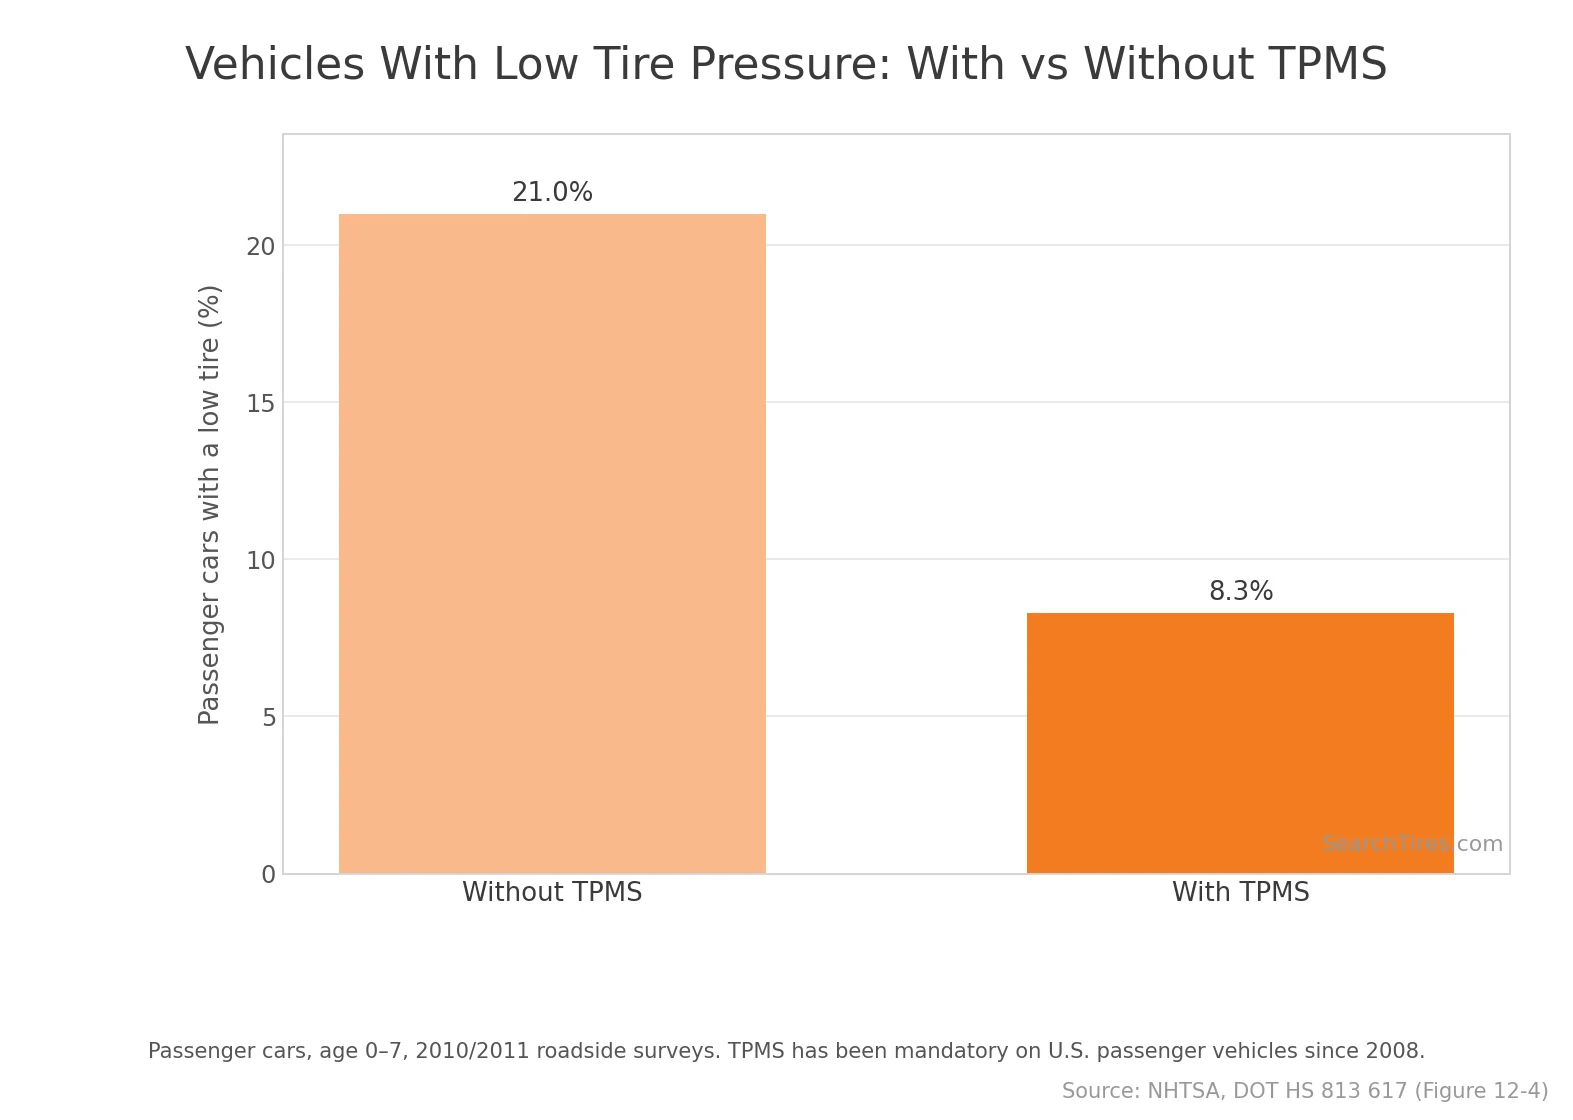
- Only 19% of consumers properly inflate their tires, despite universal TPMS adoption in passenger vehicles since 2008.
- Only 42% of drivers regularly check their tire pressure.
- Motorists driving on tires underinflated by 25% or more are 3× as likely to be involved in a tire-related crash compared to those with properly inflated tires.
- 10% of tires underinflated by more than 25% belong to tire-related crash vehicles — the highest concentration among the three underinflation categories NHTSA tracks.
- Properly inflated tires save drivers as much as 11 cents per gallon on fuel — underinflation creates sidewall flexion that worsens rolling resistance and reduces fuel economy.
- 59% of drivers check tire pressure and tread depth when bad weather is forecasted (Hankook 2024 survey, n=1,012), suggesting weather is the most common pressure-check trigger rather than routine maintenance.
- FMVSS 138 requires TPMS to warn drivers when one or more tires fall to 25% or more below recommended pressure — the threshold where crash risk triples.
Tire Tread Wear & Aging Statistics
Tire performance degrades with both tread wear and calendar age. NHTSA's tire aging research and AAA's tread depth testing both conclude that the federal 2/32-inch legal minimum is not a meaningful safety threshold — measurable performance loss begins well before legal end-of-life.
- The federal legal minimum tread depth for passenger tires is 2/32 of an inch under NHTSA TireWise guidance, but most tire safety experts — including AAA and Consumer Reports — recommend replacement at 4/32 of an inch to preserve wet-weather braking.
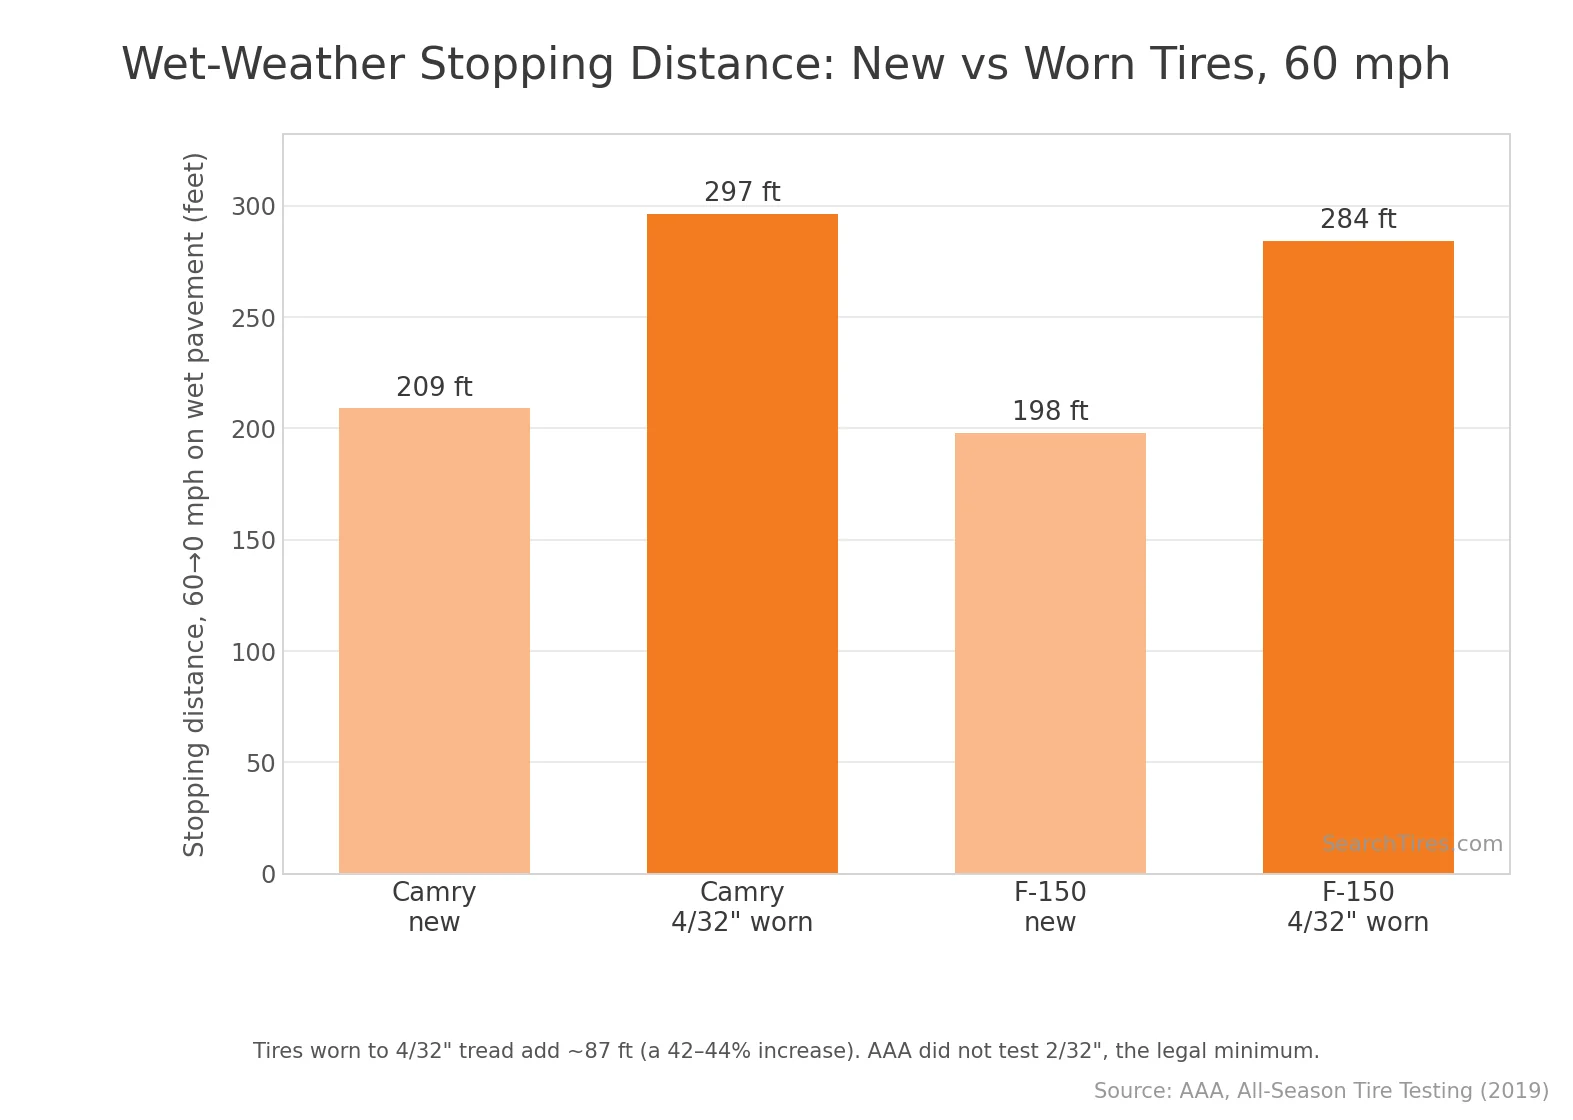
- AAA's controlled-environment testing found tires at 4/32-inch tread require approximately 87 additional feet to stop in wet conditions at 60 mph — a 43% increase in stopping distance versus new tires.
- In AAA testing, vehicles braking at 60 mph on wet pavement with mostly worn tires were still traveling at 40 mph at the point where vehicles with new tires had already stopped.
- 84% of tire claims in five hot-climate states involved tires more than six years old — establishing the basis for the 6-year service-life guideline.
- 77% of tire-aging insurance claims came from five hot-climate states (Arizona, California, Florida, Nevada, and Texas), reflecting heat acceleration of tire compound degradation.
- Most tire and vehicle manufacturers recommend replacing tires 6 to 10 years from date of manufacture, regardless of remaining tread depth.
- Tire aging operates through two mechanisms: thermo-oxidative degradation of the rubber compound at belt-edge interfaces, and cyclic fatigue from deformation under load — both accelerated by heat.
Vehicle-Specific Safety Statistics
Tire-failure risk and crash outcome vary significantly by vehicle type. SUVs and pickups, with their higher centers of gravity, are disproportionately affected by tire-failure-induced rollovers. Commercial trucks face their own dedicated safety regime.
- SUVs experiencing pre-crash tire issues have a 45% rollover rate in tire-related crashes, significantly higher than passenger cars.
Rollover Death Share by Vehicle Body Style (2023)
- In 2023, rollover crashes accounted for 21% of occupant deaths in cars, 34% in SUVs, and 38% in pickups.
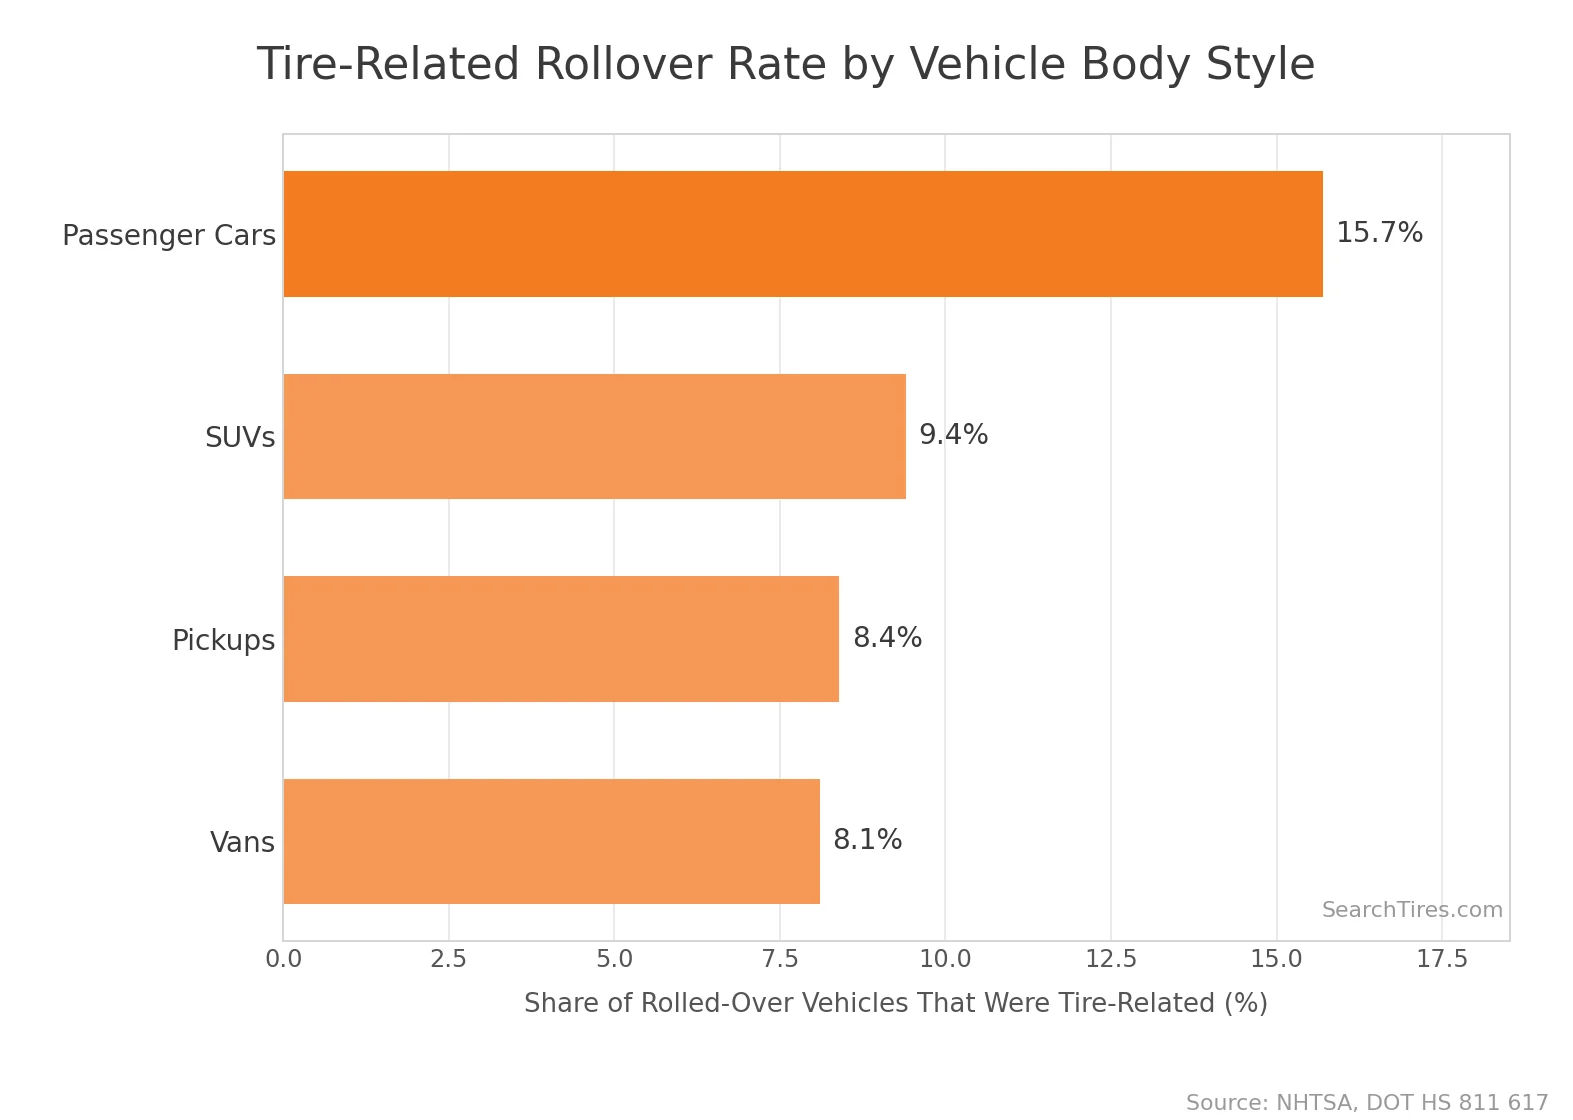
- 15.7% of all rolled-over passenger cars were tire-related crash vehicles — the highest rate among body styles (SUVs 9.4%, pickups 8.4%, vans 8.1%).
- Electric vehicles wear tires 20–30% faster than comparable internal combustion vehicles due to higher curb weight and instant torque, which compresses replacement cycles and accelerates exposure to under-tread driving.
- Average EV tire lifespan is 20,000–40,000 miles, compared to 50,000–70,000 miles on ICE vehicles.
- Federal regulations under 49 CFR 393.75 require a minimum tread depth of 4/32 inch on steer tires and 2/32 inch on drive and trailer tires for commercial vehicles — stricter than passenger-car standards.
- CVSA's out-of-service (OOS) criteria are stricter still: any commercial steer tire below 2/32 inch (rather than 4/32) and any other tire below 1/32 inch (rather than 2/32) is placed out of service on the spot.
- At the 2024 CVSA International Roadcheck, 2,821 tire-related out-of-service violations were issued, representing 20.8% of all OOS violations and making tires the second-most-cited vehicle defect after brake systems.
Tire Safety by State
Tire-related crash rates are unevenly distributed across the U.S. The five hottest-climate states drive most tire-aging insurance claims, and large-truck fatalities — where tire failures play an outsized role — concentrate in the same handful of states.
- 77% of tire-aging insurance claims came from five hot-climate states between 2002 and 2006: Arizona, California, Florida, Nevada, and Texas.
- In 2023, Texas led the nation in large-truck-crash fatalities with 730 deaths, followed by California (392) and Florida (341) — the same three states that lead in tire-aging claims.
- NHTSA's Phoenix-Ford oxidative aging protocol uses Phoenix, Arizona service conditions as the benchmark for accelerated tire aging — the basis for the industry-standard 6-year tire service-life guideline used by both Ford OE fitments and most major tire and vehicle manufacturers.
- Texas, California, and Florida together accounted for over 1,460 large-truck-related deaths in 2023, with tire and brake defects among the most-cited vehicle factors.
- States with the highest summer temperatures and longest interstate-mileage exposure — Texas, Arizona, Nevada, Florida — produce disproportionate share of tire-blowout fatalities, given that 70%+ of blowouts occur at speeds above 50 mph.
Tire Recall Statistics (2020–2025)
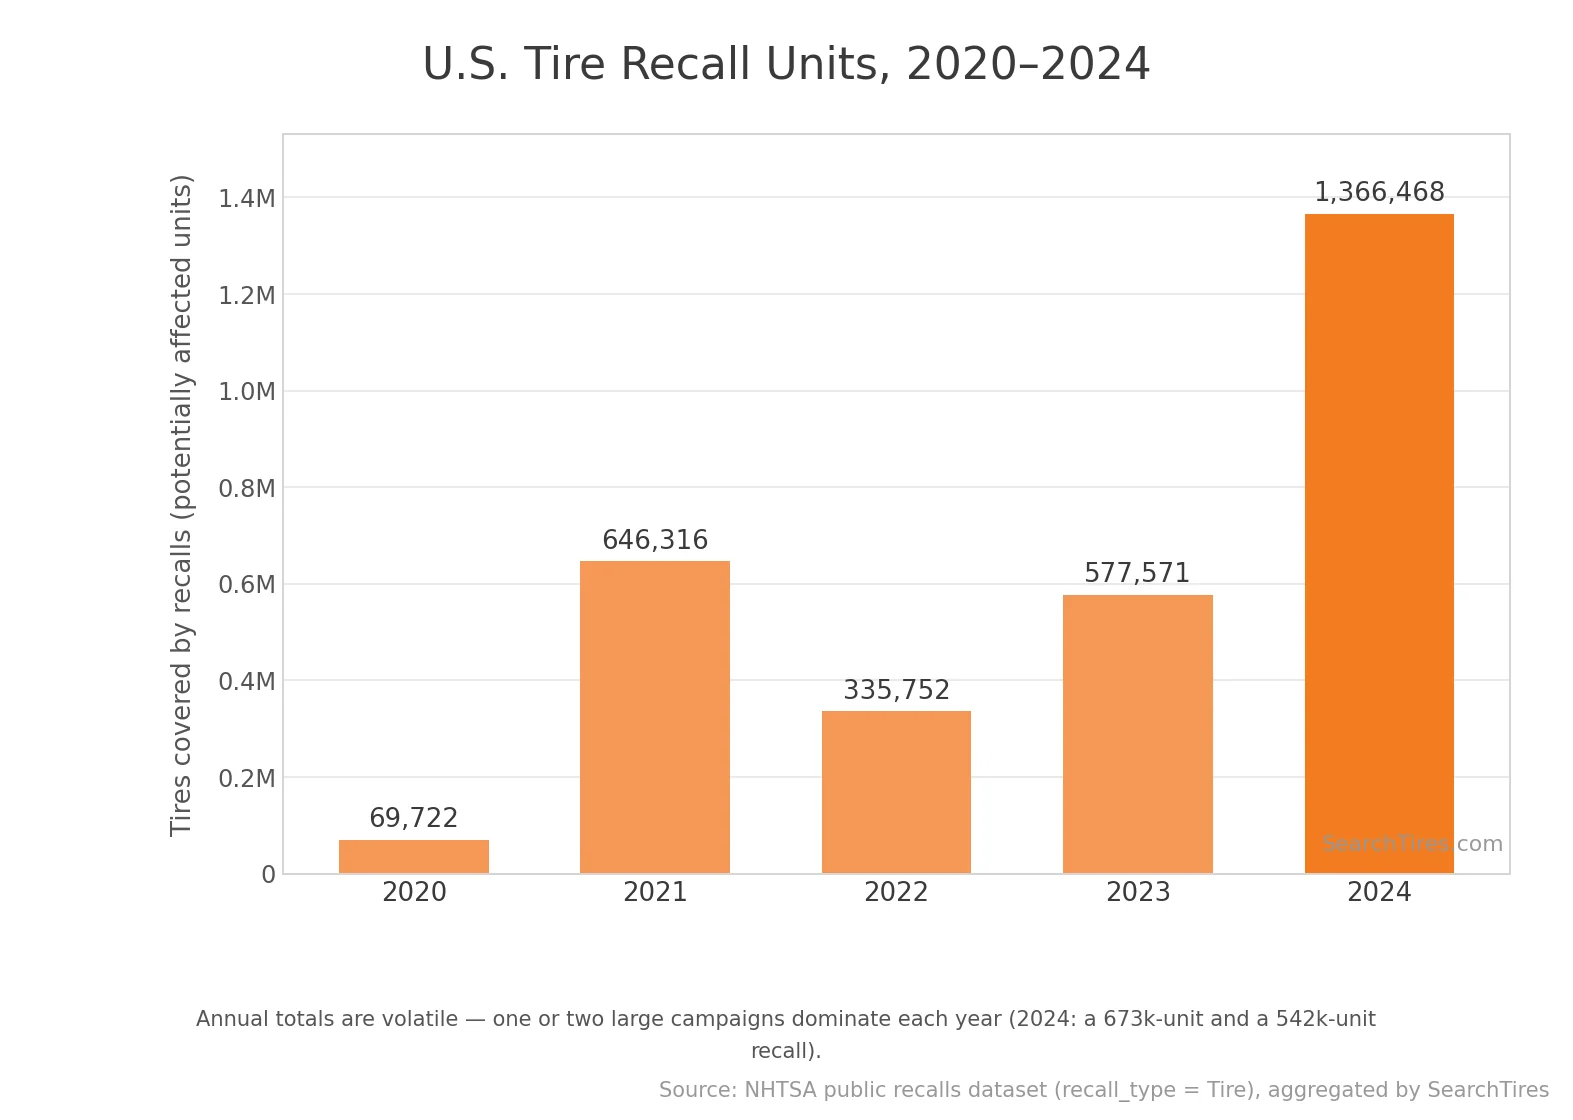
The NHTSA Office of Defects Investigation processes tire recalls under its safety-defect authority. Tire recalls — typically initiated by manufacturers — affect millions of units per year and represent a key indicator of supplier-side quality risk.
- NHTSA processes 1,000+ vehicle and equipment recalls per year, with tire-specific recalls representing a single-digit percentage of total recall events but multi-million-unit volumes.
- In December 2024, Prinx Chengshan Tire North America recalled 541,632 units — one of the larger single-event tire recalls of the 2020s.
- The four largest tire recalls of the modern era — Firestone Wilderness AT, BFGoodrich, Goodyear G159, and Cooper CS5 — collectively affected more than 25 million tires.
- Tire recalls are searchable by VIN and tire identification number (TIN) through the USTMA Tire Recall Lookup and NHTSA Recall Database, both free and updated continuously.
- The 2024 NHTSA Annual Recall Report documents recall completion rates well under 100% — tire recalls in particular have low completion because consumers do not register tires and cannot be notified directly.
- A federal penalty of $1,000 to $16,000 per violation applies to commercial-vehicle operators who fail to address out-of-service tire conditions, including recalled tires still in service.
Prevention, TPMS & Driver Behavior
The data is clear: most tire-related crashes are preventable through routine maintenance. The barrier is behavioral, not technical — TPMS technology is universal in U.S. passenger vehicles, but only a minority of drivers act on its warnings.
- All passenger vehicles sold in the U.S. since September 2008 are required to include TPMS under FMVSS 138.
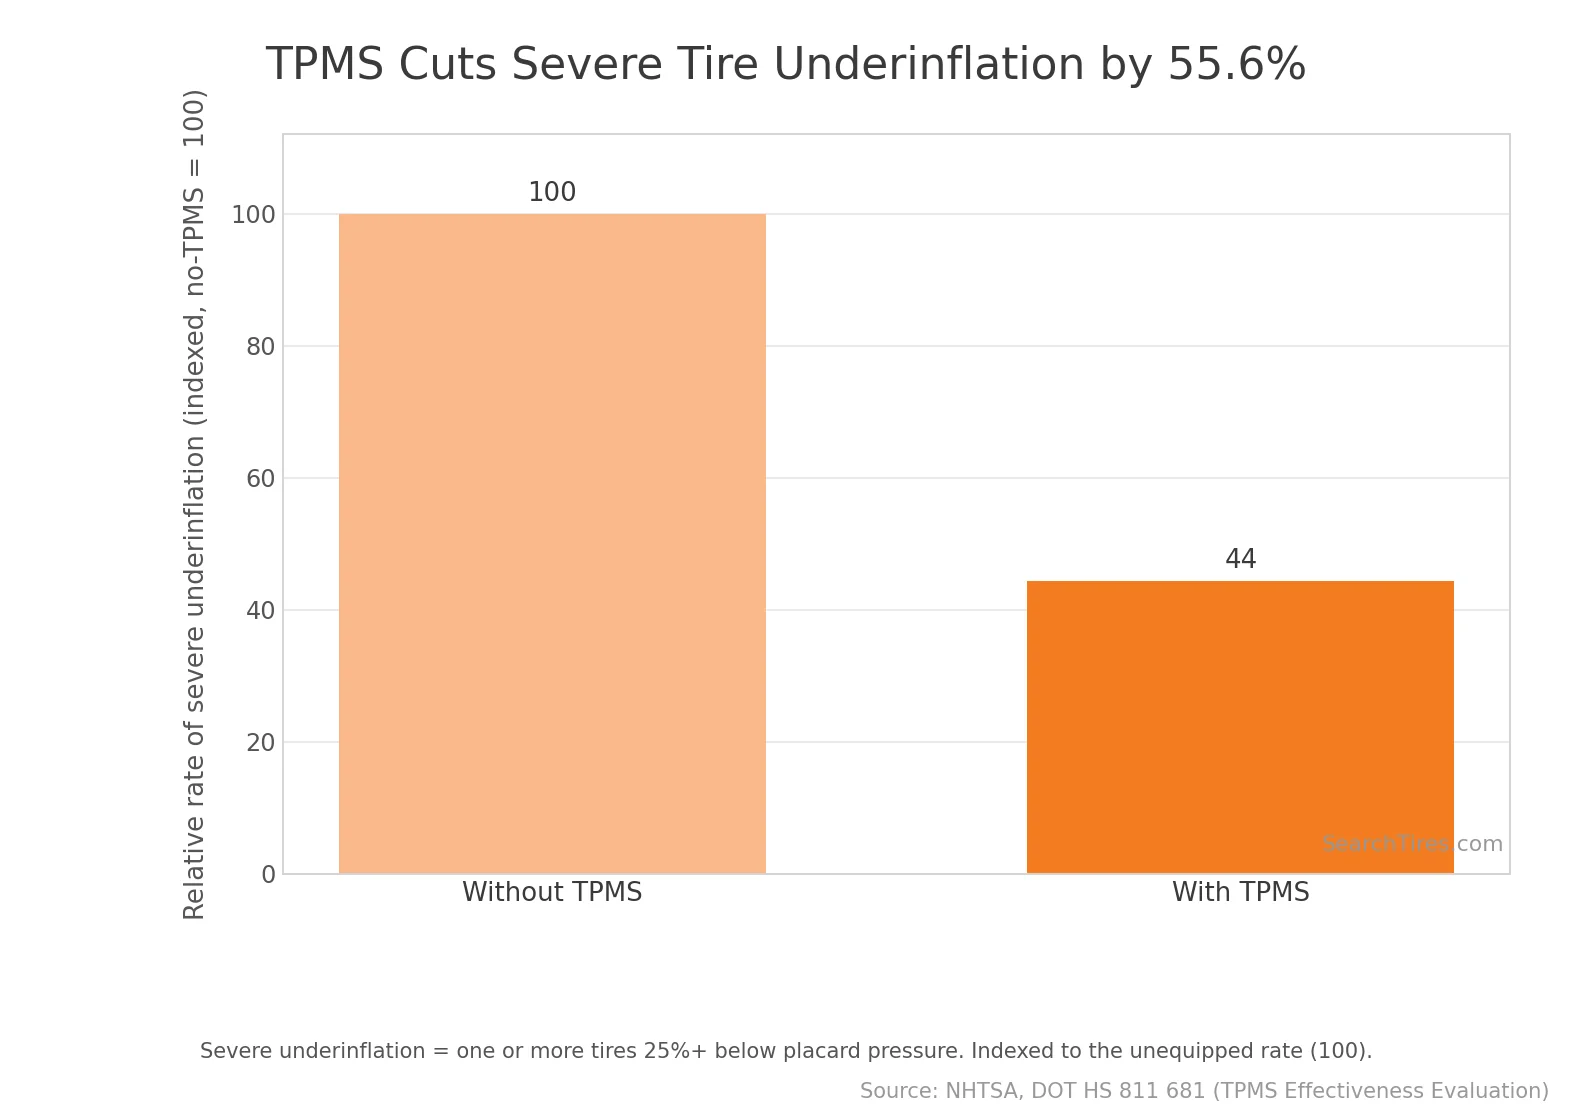
- TPMS effectiveness studies show 55.6% reduction in severe underinflation (≥25%) for vehicles equipped with the standard versus comparable unequipped vehicles.
- Despite universal TPMS deployment, only 19% of consumers properly inflate their tires, indicating that the warning light alone is insufficient to change behavior.
- 65% of U.S. drivers now feel confident changing a tire themselves, up from 52% in 2015 — a meaningful improvement in roadside-emergency self-sufficiency.
- 45% of Americans report relying more on professionals to handle basic maintenance due to increased vehicle technology — including tire pressure and tread checks once routine for DIY drivers.
- NHTSA TireWise recommends drivers check tire pressure monthly, inspect tread depth monthly, rotate tires every 5,000–8,000 miles, and verify alignment annually. Properly inflated tires also extend average tire life by approximately 4,700 miles.
Frequently Asked Questions
How many crashes per year are caused by tire failures?
What percentage of tire failures involve underinflated tires?
At what speed do most tire blowouts happen?
How old is too old for a tire?
What is the safest tread depth?
Are SUVs more dangerous than cars in tire-failure crashes?
How can I check if my tires have been recalled?
Related Topics
Continue exploring tire data:
- Tire Industry Statistics 2026: 50+ Key Stats You Need to Know — comprehensive hub of all tire industry data.
- Flat Tire Statistics — frequency of flats, causes, and roadside-assistance data — the natural companion to safety.
- Tire Recycling & Environmental Statistics 2026 — end-of-life tire recovery rates and microplastics.
- EV Tire Statistics 2026 — EV-specific tire wear and roadside-event data.
Methodology & Sources
Data on this page is compiled from authoritative public sources between 2024 and 2026 — government agencies (USTMA, NHTSA, BLS/FRED), industry associations, publicly traded tire-company annual reports, and named market-research firms. Each statistic is grouped below under the body section it supports. This page is reviewed annually; if you find a stat that has changed, please reach out.
Tire-Related Crash & Fatality Statistics
Tire Blowout Statistics
- Industry crash analyses; NHTSA FARS-derived
- NHTSA tire failure research; industry crash analyses
- NHTSA seasonal crash analysis; industry tire-failure reporting
- NHTSA, DOT HS 811 086 — Tire Pressure Maintenance: A Statistical Investigation
- FMCSA Large Truck Crash Causation Study
Flat Tire Statistics
- AAA roadside assistance data
- Industry estimates via Tire Industry Association
- Hankook Gauge Index / industry surveys
- AAA / industry inventory
Tire Underinflation & Pressure Statistics
- Rubber Manufacturers Association
- NHTSA, DOT HS 813 617
- NHTSA / Hankook Gauge Index
- NHTSA, DOT HS 811 086
- NHTSA, DOT HS 811 617
- NHTSA TireWise
- NHTSA FMVSS 138
Tire Tread Wear & Aging Statistics
- NHTSA TireWise; AAA; Consumer Reports
- AAA Tire Study, 2019
- NHTSA, DOT HS 811 885 / Tire Aging Test Development
Vehicle-Specific Safety Statistics
- NHTSA
- IIHS Fatality Facts, 2023
- NHTSA, DOT HS 811 617
- Bridgestone / Michelin
- U.S. DOT, 49 CFR 393.75
- CVSA OOS Criteria
- CVSA, 2024 International Roadcheck Results
Tire Safety by State
- NHTSA Tire Aging Test Development
- FMCSA / Truck Accident Statistics 2023
- NHTSA / industry crash analysis
Tire Recall Statistics (2020–2025)
Prevention, TPMS & Driver Behavior
- NHTSA FMVSS 138
- NHTSA, DOT HS 811 681 — TPMS Effectiveness Evaluation
- NHTSA, DOT HS 813 617
- Hankook Tire Gauge Index, 2024
- NHTSA TireWise
© 2026 SearchTires.com. This page may be cited with attribution. If you use our data in a publication, please link back to this page as the source.