Tire Industry Statistics 2026: 50+ Key Stats You Need to Know
50 tire industry statistics for 2026 covering market size, brand share, EV adoption, prices, safety, recycling, and trends. Sourced and reviewed annually.
*Last updated: February 2026 · Reviewed annually*
The global tire industry is one of the largest segments of the automotive sector, generating hundreds of billions of dollars in economic activity and employing hundreds of thousands of workers. Whether you're a consumer comparing tire prices, a journalist researching market trends, or an industry professional tracking shipment data, this page compiles the most important tire industry statistics in one place — all sourced and cited.
Key Findings
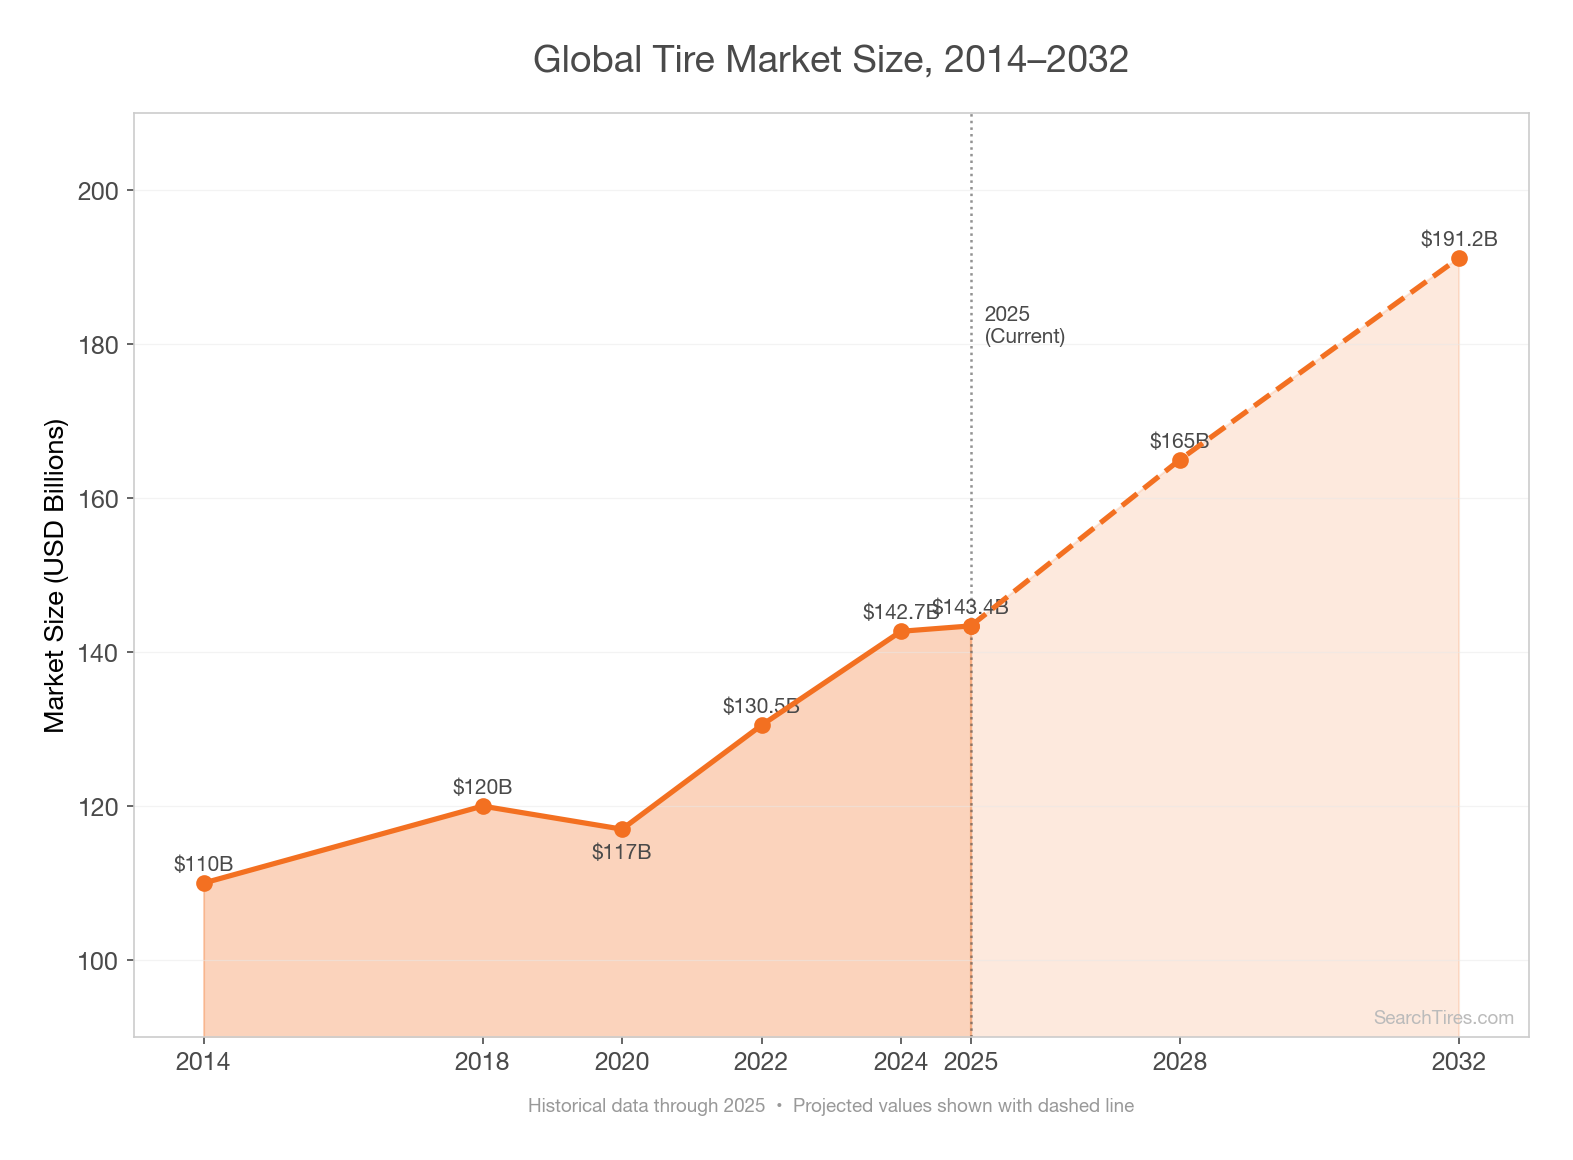
- The global tire market was valued at $143.4 billion in 2025 and is projected to reach $191.2 billion by 2032.
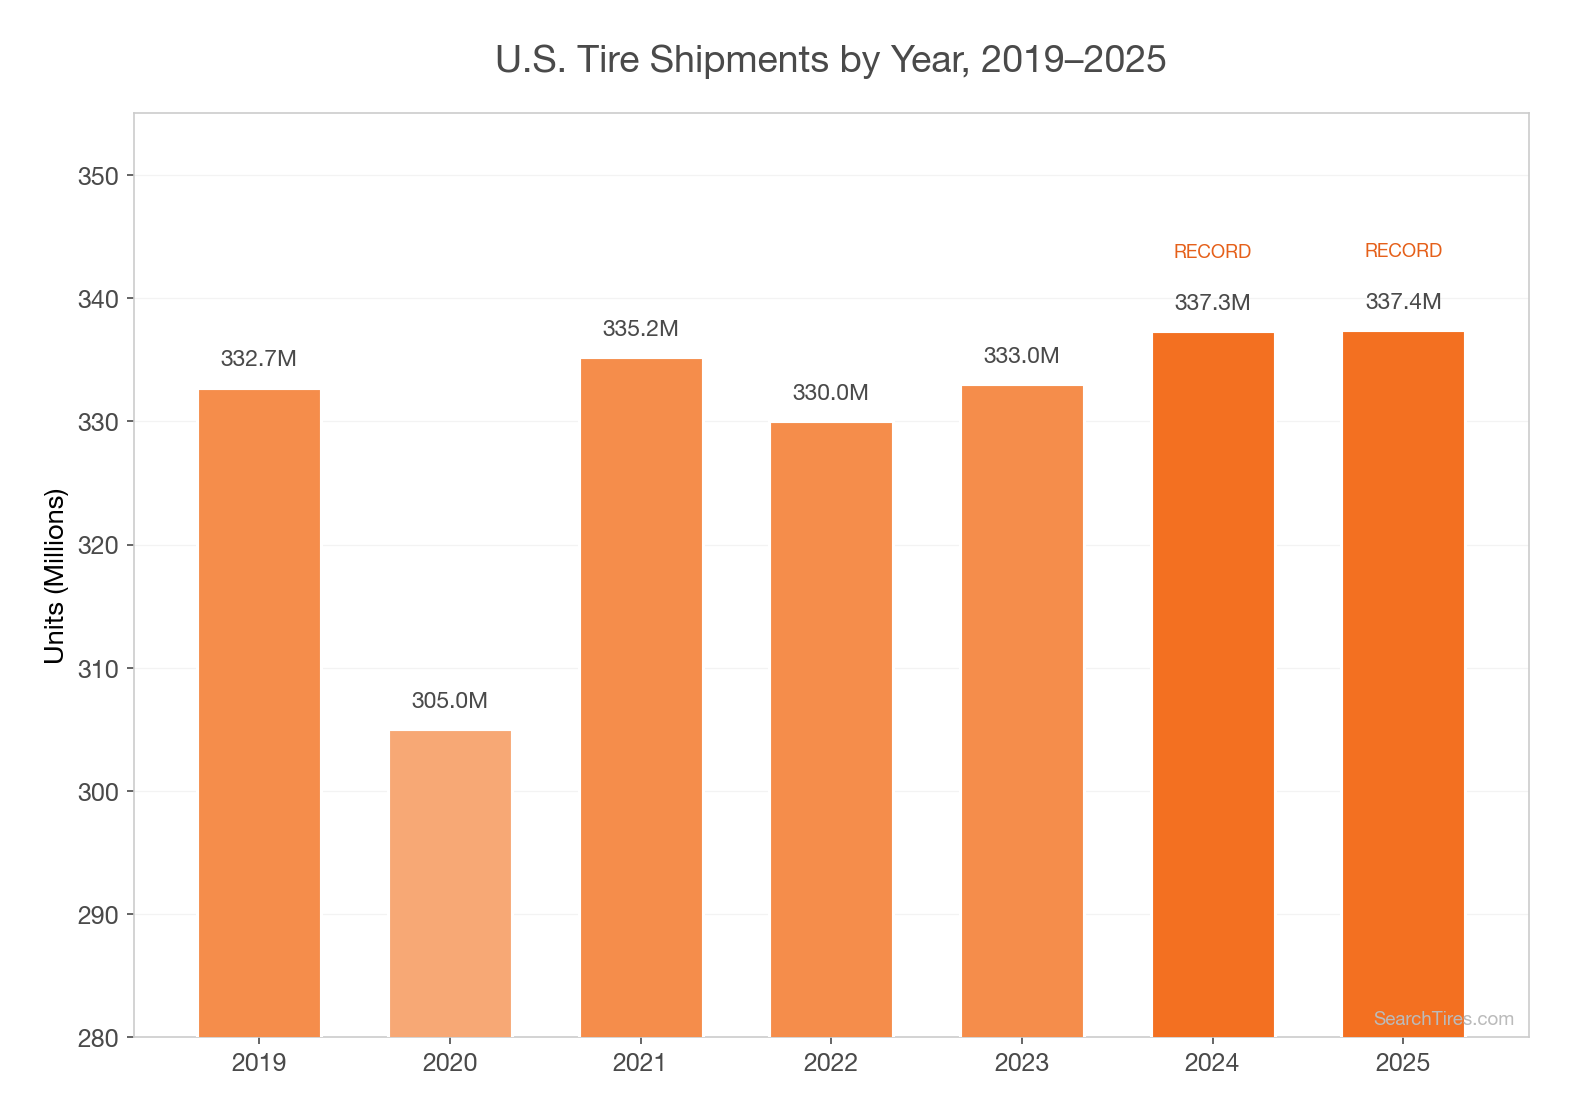
- The U.S. tire industry shipped 337.4 million units in 2025, roughly on par with the 2024 record of 337.3 million.
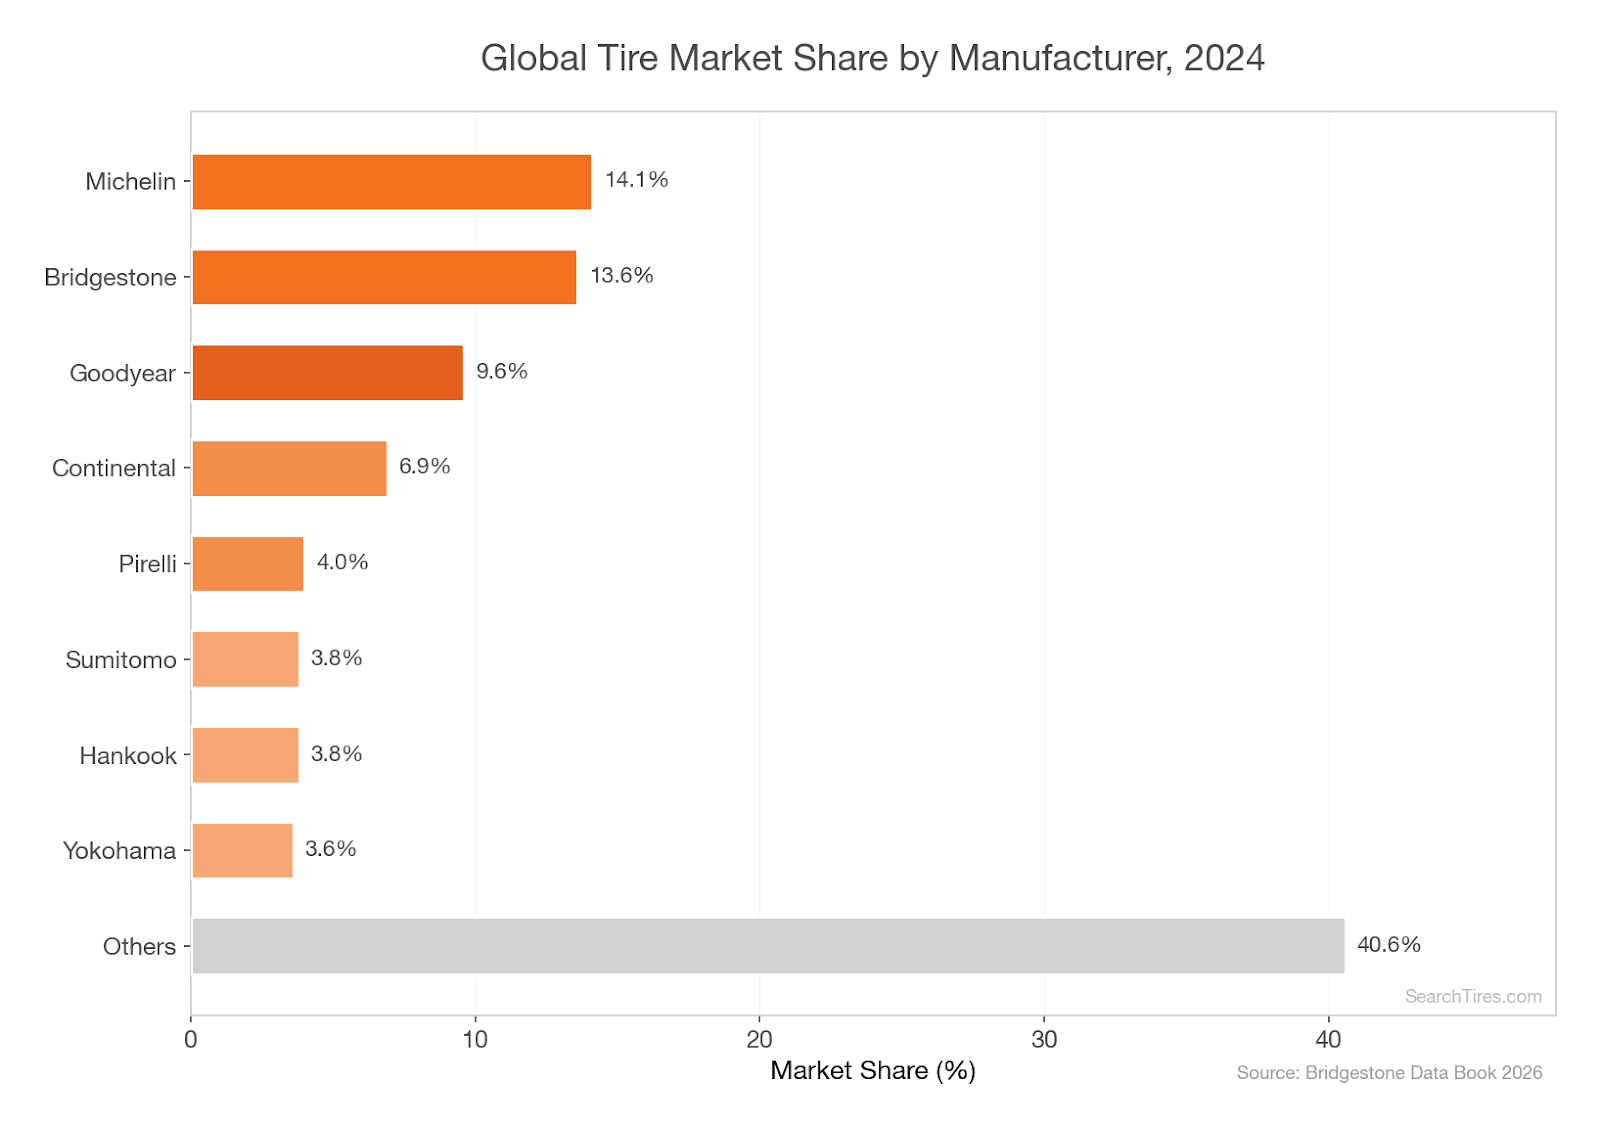
- Michelin is the world's largest tire company by market share at 14.1%, followed by Bridgestone (13.6%) and Goodyear (9.6%).
- U.S. tire manufacturing has an annual economic footprint of $259.5 billion and supports more than 936,000 American jobs (USTMA, 2025).
- An estimated 78,392 crashes occur annually in the U.S. due to flat tires or blowouts.
- The EV tire market is projected to grow from $11.2 billion in 2025 to $27.4 billion by 2032, a CAGR of 13.6%.
- 79% of end-of-life tires were recycled or reused in the U.S. in 2023, up 10.5% from prior reporting.
Table of Contents
- Tire Market Size & Revenue Statistics
- Tire Sales & Shipment Statistics
- Tire Brand Market Share Statistics
- Tire Pricing Statistics
- Tire Manufacturing & Employment Statistics
- Tire Safety Statistics
- Tire Recycling & Environmental Statistics
- EV Tire Statistics
- Tire Industry Trends & Forecasts
- Frequently Asked Questions
- Methodology & Sources
Tire Market Size & Revenue Statistics
The tire industry is a massive global market that continues to grow, driven by rising vehicle ownership, an expanding global middle class, and the accelerating shift to electric vehicles.
- The global tire market was valued at $143.4 billion in 2025 and is projected to reach $191.2 billion by 2032, growing at a CAGR of 4.2%.
- Grand View Research valued the global tire market at $143.1 billion in 2024, projecting growth to $173.9 billion by 2030 at a 3.4% CAGR.
- The global tire market grew 9.3% between 2022 and 2024, from $130.5 billion to $142.7 billion.
- The U.S. tire dealer industry generated $47.5 billion in revenue in 2025, up 4.6% from $47.2 billion in 2024.
- U.S. tire manufacturing revenue was $25.4 billion in 2024 and is projected at $26.8 billion for 2026.
- U.S. tire wholesaling generated $97.5 billion in revenue in 2026.
- North American tire sales are expected to grow by $59.7 billion between 2025 and 2029.
- Revenue generated by the nation's tire dealers is expected to grow 5.6% annually through 2027, reaching $42.5 billion.
Tire Sales & Shipment Statistics
The United States is one of the world's largest tire markets, with hundreds of millions of units shipped annually across passenger, light truck, and commercial segments.
- 337.4 million tires were shipped in the U.S. in 2025, compared to 337.3 million in 2024 and 332.7 million in 2019.
- 337.3 million tires were shipped in the U.S. in 2024, setting a record at that time and surpassing the previous record of 335.2 million in 2021.
- Of the tires shipped in the U.S. in 2022, 216.1 million were replacement passenger tires and 41.5 million were original equipment (OE) passenger tires.
- Light truck tires accounted for 37 million replacement units and 6.2 million OE units shipped in the U.S. in 2022.
- An estimated 2.5 billion tires are produced worldwide annually, based on production trends rising from 2.27 billion units in 2021.
- Goodyear sold 166.6 million tire units globally in 2024.
- USTMA's 11 member companies operate 55 tire-related manufacturing facilities in 16 states.
Tire Brand Market Share Statistics
The global tire industry is led by three dominant players — Michelin, Bridgestone, and Goodyear — though smaller brands and Chinese imports have been gaining ground over the past decade.
Global Market Share (by Revenue, 2024)
Based on 2024 sales revenue data from the Bridgestone Data Book 2026:
| Rank | Company | Global Market Share |
|---|---|---|
| 1 | Michelin | 14.1% |
| 2 | Bridgestone | 13.6% |
| 3 | Goodyear | 9.6% |
| 4 | Continental | 6.9% |
| 5 | Pirelli | 4.0% |
| 6 | Sumitomo | 3.8% |
| 7 | Hankook | 3.8% |
| 8 | Yokohama | 3.6% |
- Michelin led all tire companies with $28.4 billion in global sales in 2024.
- Bridgestone posted global revenue of $28.9 billion in 2024 (¥4,430.1 billion), a 3% year-over-year increase.
- Goodyear recorded net sales of $18.9 billion in 2024, a 5.9% decline from 2023, with 166.6 million tire units sold.
- Continental's tire division achieved €13.9 billion ($14.6 billion) in revenue for 2024.
- Over the past 10 years, Goodyear, Michelin, and Bridgestone combined have lost over 4 percentage points of market share in the U.S. replacement tire market.
U.S. Replacement Tire Brand Share
- Goodyear held 10.5% of the U.S. passenger replacement tire market and 9% of the light truck replacement market in 2022.
- As of early 2025, Goodyear remained the leading tire brand in the U.S. by both unit and dollar share at 14.6% unit share.
U.S. Retail Market Share
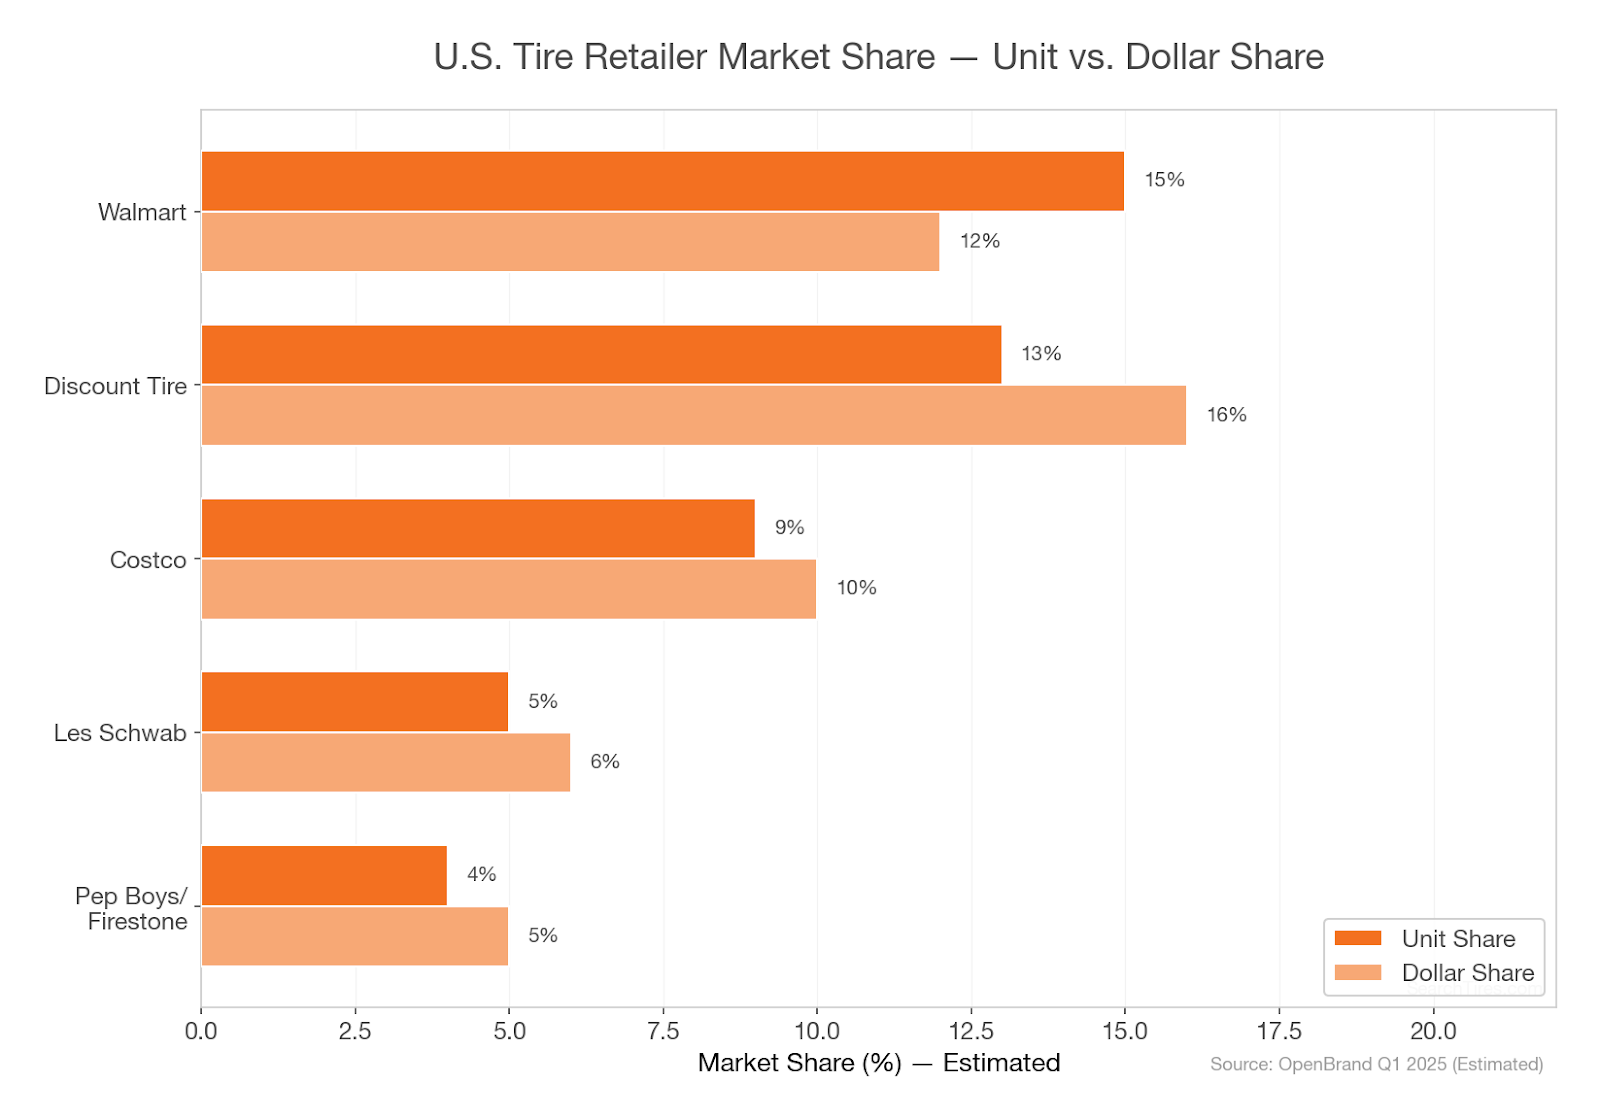
- Walmart is the #1 tire retailer by unit share in the U.S., accounting for 15% of units sold.
- Discount Tire leads in dollar share at 16% of the U.S. tire retail market.
- Discount Tire / America's Tire had sales of $9.65 billion in 2024, making it the top North American tire retailer by sales.
Tire Pricing Statistics
Tire prices vary significantly by type, brand, and vehicle category — but have been trending upward due to raw material costs and inflation.
- Budget tires typically cost $50 to $150 each, mid-range tires cost $100 to $300, and premium or specialty tires can cost $300 to $1,000+.
- The median price paid for a new tire in the U.S. was $223, according to the most recent Consumer Reports survey.
- A complete set of four new tires typically costs U.S. consumers between $460 and $1,280.
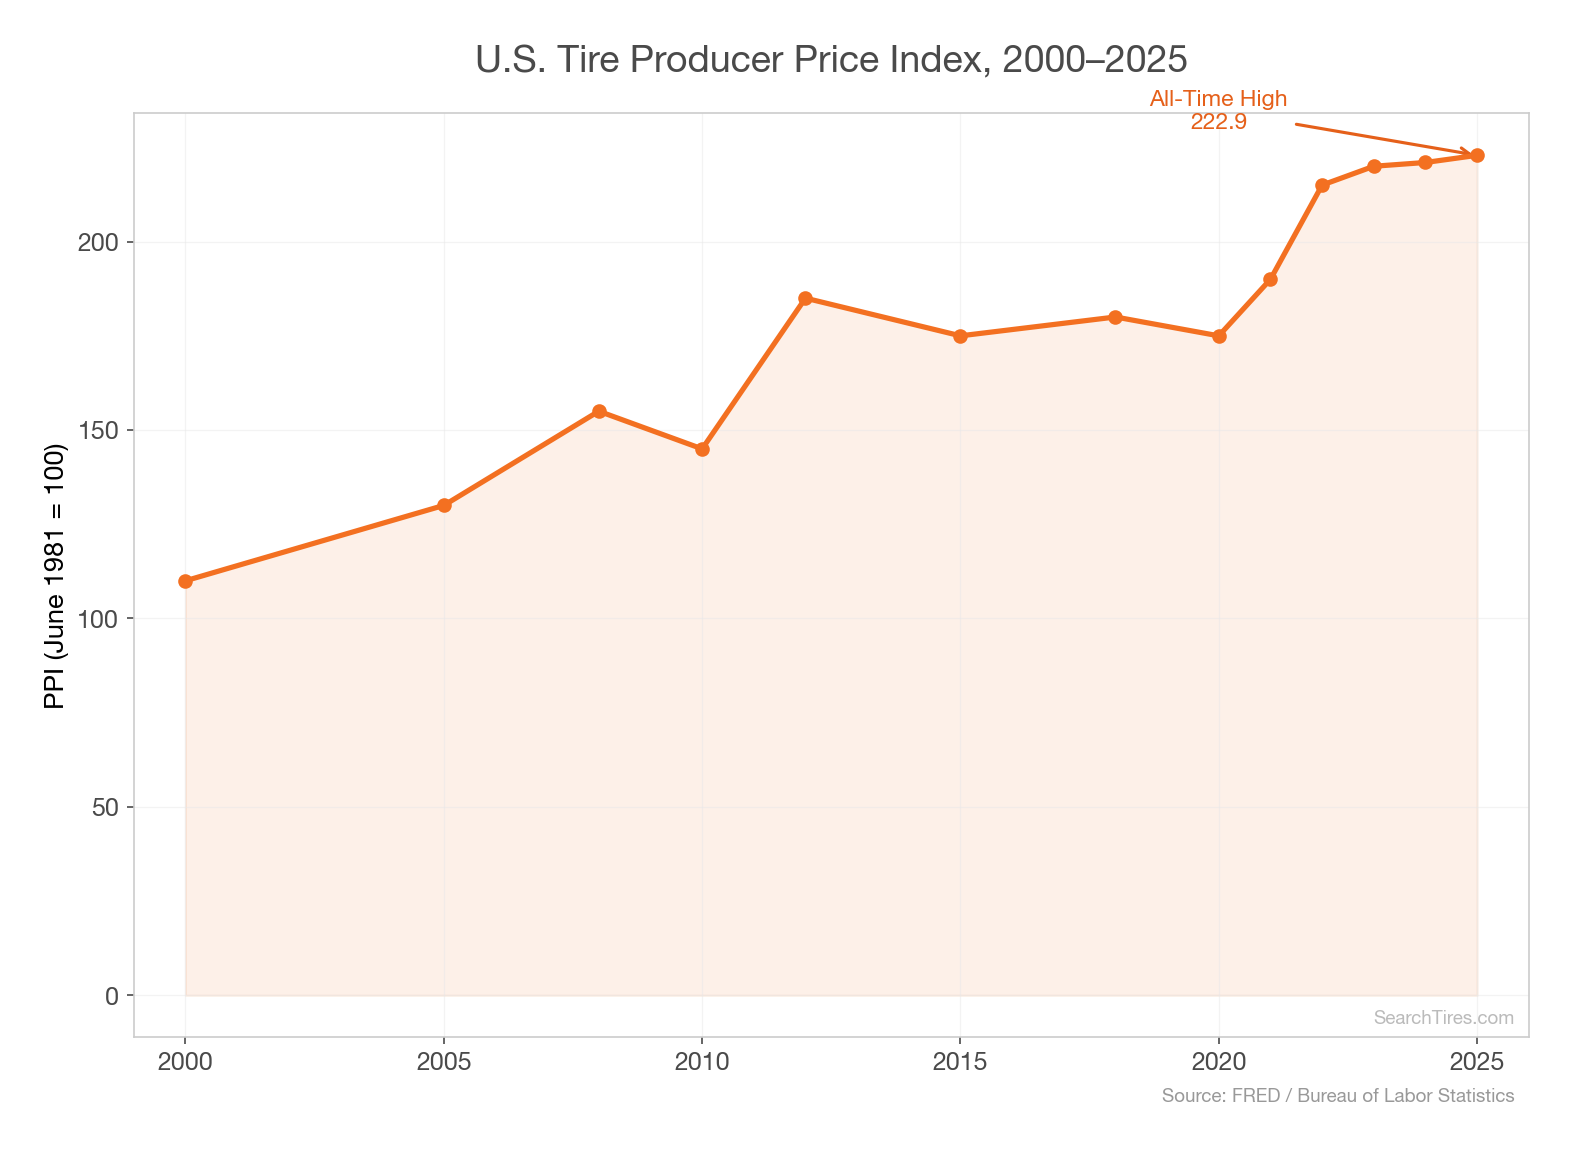
- The U.S. Producer Price Index for tire manufacturing reached 222.9 (base: June 1981 = 100) in November 2025, near an all-time high.
- Major tire manufacturers implemented multiple price increases from 2021 to 2023, with Goodyear raising consumer tire prices by up to 12% in 2022 alone.
- Average tire installation cost is approximately $31 per tire.
Tire Manufacturing & Employment Statistics
The U.S. tire industry is a significant employer, supporting hundreds of thousands of jobs across manufacturing, distribution, retail, and supply chain operations.
- U.S. tire manufacturing has an annual economic footprint of $259.5 billion (USTMA, 2025).
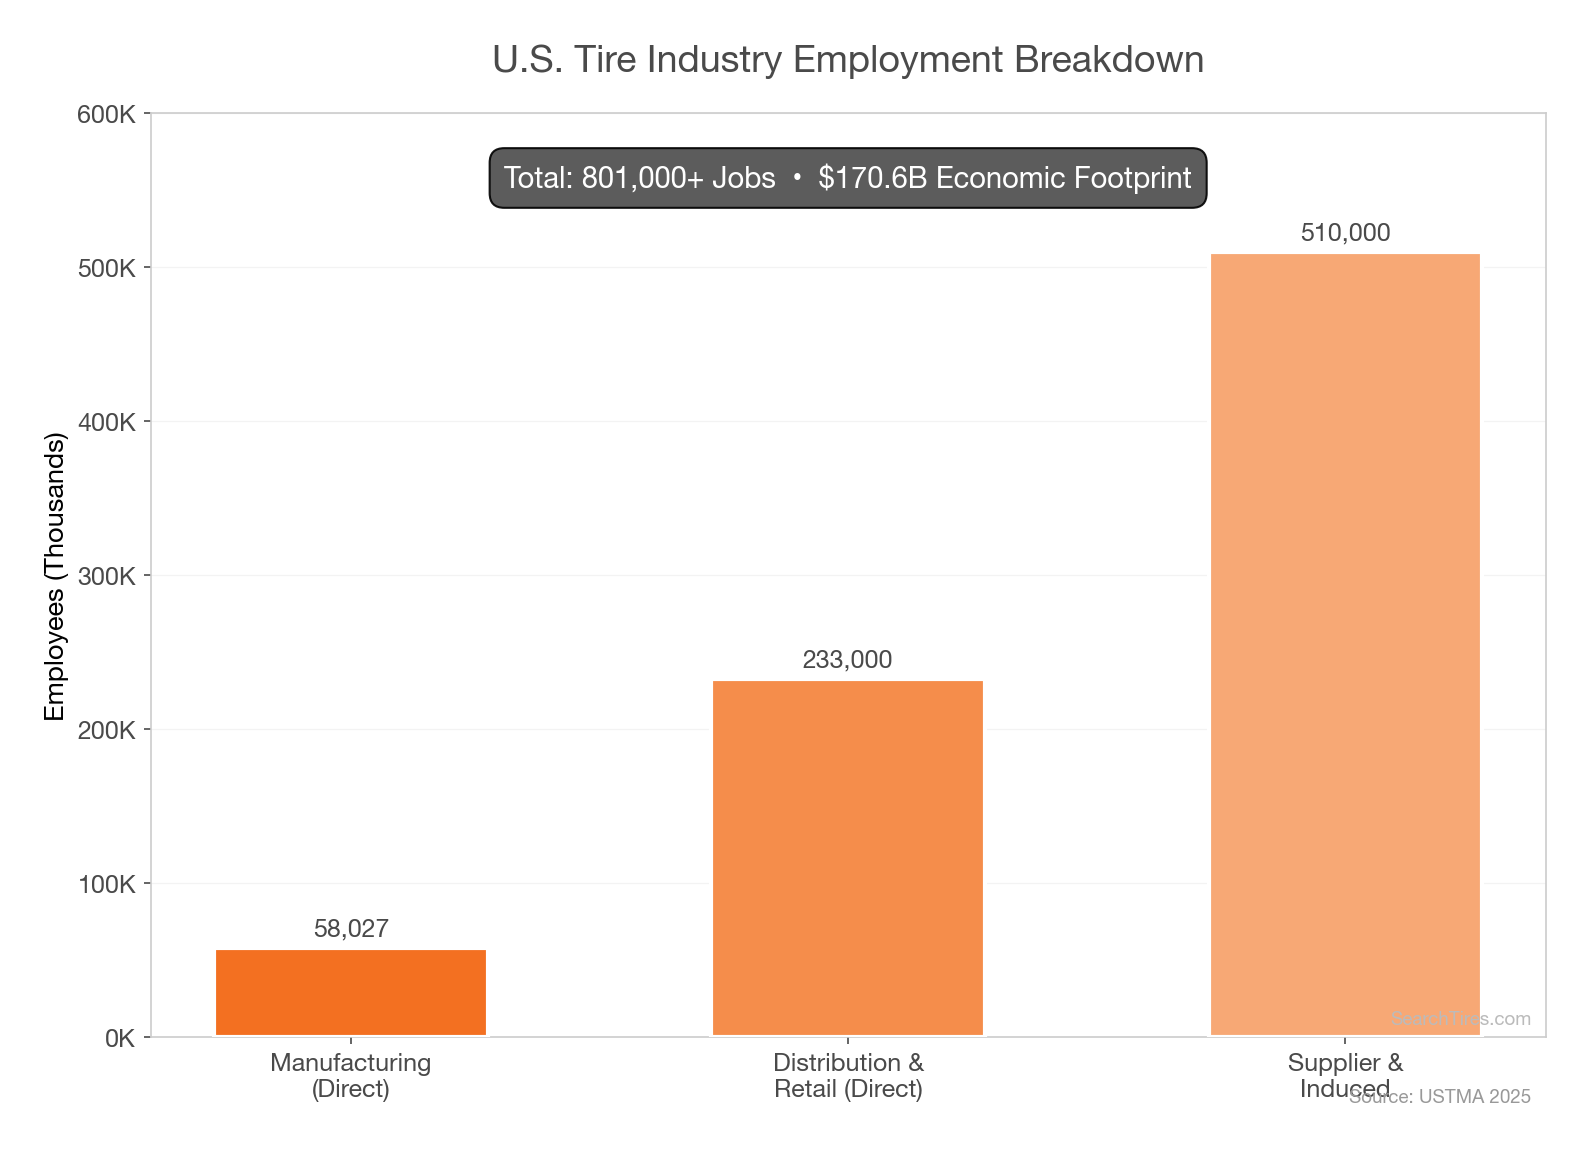
- The tire industry is directly responsible for more than 291,000 U.S. jobs in manufacturing, distribution, and retailing.
- An additional 606,477 U.S. jobs are supported through supplier and induced activities, bringing the total to more than 936,000 jobs.
- There were 58,027 people employed directly in tire manufacturing in the U.S. as of 2024.
- There were 303 tire manufacturing businesses operating in the U.S. as of 2024.
- There are 31,858 tire dealer businesses in the United States as of 2025, an increase of 2.1% from 2024. The number grew at a CAGR of 3.2% per year from 2019 to 2024.
- USTMA's member companies operate 55 tire-related manufacturing facilities across 16 states.
- As of June 2025, U.S. manufacturing payroll employment declined by 89,000 jobs over the prior 12 months, reflecting broader manufacturing headwinds.
Tire Safety Statistics
Tire failures remain a significant factor in motor vehicle crashes. Proper maintenance — especially tire pressure monitoring and tread depth checks — can prevent many tire-related accidents.
- An estimated 78,392 crashes occur annually in the U.S. due to flat tires or blowouts.
- Tire-related crashes result in an estimated 10,275 non-fatal injuries per year.
- An estimated 414 fatalities per year are attributed to flat tires or blowouts.
- In 2017, a total of 738 fatalities occurred on U.S. roads from tire-related crashes.
- According to the National Motor Vehicle Crash Causation Survey (NMVCCS), 9% of crashes involved a vehicle with pre-crash tire problems.
- Approximately 69% of vehicles on the road have at least one underinflated tire.
- Only 42% of drivers regularly check their tire pressure.
- SUVs experiencing tire issues have a 45% rollover rate in tire-related crashes, significantly higher than passenger cars.
Tire Recycling & Environmental Statistics
End-of-life tire management has improved dramatically over the past three decades, but scrap tire generation continues to outpace recycling capacity. Environmental concerns — particularly around tire-derived microplastics — are growing.
- Approximately 250 million scrap tires are discarded in the United States each year.
- 79% of end-of-life tires in the U.S. were recycled or reused in 2023, a 10.5% increase from prior reporting.
- In the past 40 years, 95% of the 1 billion scrap tires that were in U.S. stockpiles have been cleaned up.
- An estimated 1 billion end-of-life tires are generated globally each year.
- 78% of ocean microplastics are from synthetic tire rubber, according to a landmark report by the Pew Charitable Trust.
- Tires account for an estimated 10% of overall microplastic waste globally.
- Rubber-modified asphalt (RMA) has consumed 165,000 tons of end-of-life tires since 2021, representing a 17% increase.
EV Tire Statistics
The rapid growth of electric vehicles is creating a fast-emerging segment within the tire industry. EVs place unique demands on tires due to their heavier weight and higher instant torque, leading to faster wear and the development of EV-specific tire products.
- The global EV tire market was valued at $11.2 billion in 2025 and is projected to reach $27.4 billion by 2032, a CAGR of 13.6%.
- Electric vehicles wear through tires 20–30% faster than comparable internal combustion engine (ICE) vehicles.
- The average EV tire lifespan is 20,000–40,000 miles, compared to 50,000–70,000 miles for tires on ICE vehicles.
- OEM supply commanded 59.3% of EV tire market revenue in 2024, but the replacement channel is growing at a 14.97% CAGR due to accelerated tread wear.
- EV-specific tires feature reinforced sidewalls, advanced rubber compounds, and sound-absorbing foam technology to address the unique weight, torque, and noise characteristics of electric vehicles.
Tire Industry Trends & Forecasts
Several major trends are reshaping the tire industry heading into 2026 and beyond:
1. Steady Global Growth
The global tire market is expected to grow at a CAGR of 3.4% to 4.2% through the late 2020s and early 2030s, driven by rising vehicle ownership in developing markets and the global EV transition.
2. The EV Transition Is Accelerating Tire Demand
EVs' higher curb weight and instant torque accelerate tire wear, driving more frequent replacement cycles and creating demand for new EV-optimized tire products. The EV tire segment is the industry's fastest-growing category at 13.6% CAGR.
3. Market Share Shift Away from the Big Three
Over the past decade, Goodyear, Michelin, and Bridgestone have collectively lost over 4 percentage points of U.S. replacement market share to smaller brands and imports.
4. Rising E-Commerce Tire Sales
Online tire purchasing continues to grow, though brick-and-mortar still dominates. Approximately 13% of tire purchases are made online, with 77% still bought in-store.
5. Sustainability and Circular Economy Pressures
Tire manufacturers are investing heavily in sustainable materials and circular economy initiatives. USTMA continues to advocate for expanding rubber-modified asphalt (RMA) and other end-of-life tire applications to keep pace with annual scrap tire generation.
6. Tariff and Trade Uncertainty
Chinese tire imports face ongoing tariff pressures, while broader trade policy uncertainty may impact pricing and supply chains in 2026.
7. Tire Microplastics Under Scrutiny
With 78% of ocean microplastics traced to tire rubber, regulators and environmental groups are pushing for new tire wear standards and low-emission tire compounds.
Frequently Asked Questions
How big is the tire industry?
How many tires are sold in the US each year?
What is the most popular tire brand?
How much does the average tire cost?
How often should tires be replaced?
Related Topics
Dig deeper into specific tire data:
- Tire Market Size & Revenue Statistics 2026 — global tire market value, growth, and forecast through 2032.
- Tire Brand Market Share 2026 — global tire brand rankings and revenue share by manufacturer.
- Tire Price Statistics 2026 — average tire prices by tier, size, and brand — plus inflation trends.
- Online Tire Sales Statistics 2026 — e-commerce share, online tire buyer behavior, and channel trends.
- EV Tire Statistics 2026 — EV-specific tire wear, market growth, and OEM share.
- Flat Tire Statistics — frequency of flats, causes, and roadside-assistance data.
- Tire Safety & Blowout Statistics 2026 — crash data, tread depth, TPMS effectiveness, and underinflation risks.
- Tire Recycling & Environmental Statistics 2026 — end-of-life tire recovery rates, scrap tire markets, and microplastics.
Methodology & Sources
Data on this page is compiled from authoritative public sources between 2024 and 2026 — government agencies (USTMA, NHTSA, BLS/FRED), industry associations, publicly traded tire-company annual reports, and named market-research firms. Each statistic is grouped below under the body section it supports. This page is reviewed annually; if you find a stat that has changed, please reach out.
Tire Market Size & Revenue Statistics
- Maximize Market Research, February 2026
- Grand View Research, 2025
- ConsumerAffairs / Fortune Business Insights, 2024
- IBISWorld, 2025
- IBISWorld, 2025–2026
- IBISWorld, 2026
- Technavio, 2025
- Auto Care Association Factbook via Tire Business, 2025
- USTMA, November 2025
- Bridgestone Data Book 2026, based on 2024 data
Tire Sales & Shipment Statistics
- USTMA November 2025 Forecast
- Market Reports World / Smithers, 2024
- Goodyear 2024 Annual Results, February 2025
Tire Brand Market Share Statistics
- Bridgestone Data Book 2026 / Tire Business Global Tire Report
- Modern Tire Dealer / Michelin 2024 Annual Results
- Bridgestone 2024 Annual Results
- Goodyear Q4 2024 Earnings Release
- Continental AG Fiscal Year 2024 Results
- OpenBrand, 2024
- Statista, 2023
- OpenBrand, Q1 2025
- Tire Business, February 2025
Tire Pricing Statistics
- ConsumerAffairs, 2025
- Consumer Reports via WorkMoney, 2025
- Performance Plus Tire / Consumer Reports, 2025
- FRED / Bureau of Labor Statistics, 2025
- Tires-Easy, 2022
Tire Manufacturing & Employment Statistics
- USTMA, 2025
- IBISWorld, 2024
- IBISWorld, 2025
- Bureau of Labor Statistics via Tire Business, September 2025
Tire Safety Statistics
Tire Recycling & Environmental Statistics
- USTMA, 2025
- Pew Charitable Trust via Yale E360
- International Journal of Environmental Research and Public Health
EV Tire Statistics
Tire Industry Trends & Forecasts
- Grand View Research, 2025; Maximize Market Research, 2026
- MarketsandMarkets, 2025
- OpenBrand, 2024
- Consumer Reports / OpenBrand, 2025
- USTMA, 2025
- Tire Business, 2025
- Pew Charitable Trust
© 2026 SearchTires.com. This page may be cited with attribution. If you use our data in a publication, please link back to this page as the source.