EV Tire Statistics and Trends 2026
EV tire statistics for 2026: a B market by 2032, 20% faster wear than ICE tires, satisfaction data, top EV brands, and roadside trends.
EV Tire Statistics & Trends 2026
Last updated: May 2026 · Reviewed annually
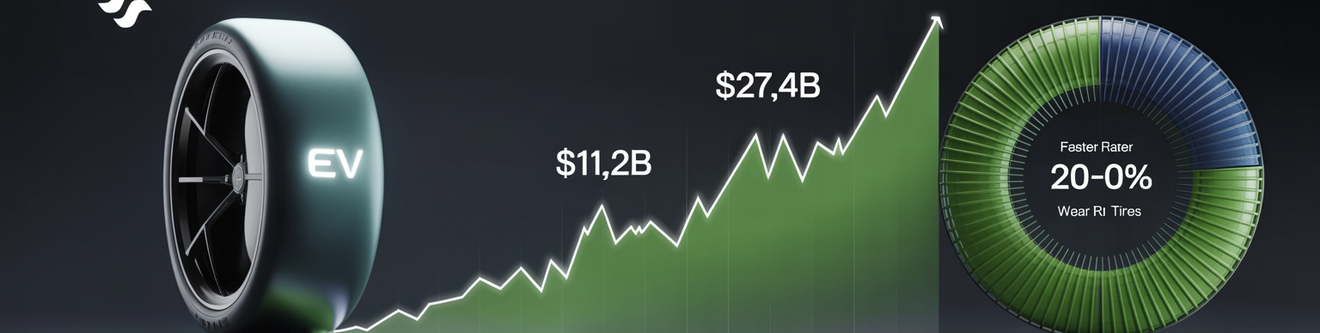
The global EV tire market is one of the fastest-growing segments of the broader tire industry — $11.21 billion in 2025, projected to reach $27.63 billion by 2032 at a 13.6% CAGR, per MarketsandMarkets. This page compiles the most-cited EV tire statistics — market size, wear rates, EV-specific tire launches, satisfaction data, adoption trends, and the EV roadside-assistance impact — with every number sourced to a primary publisher.
Key Findings
- The global EV tire market was valued at $11.21 billion in 2025 and is projected to reach $27.63 billion by 2032, at a CAGR of 13.6%.
- EV tires wear up to 20% faster than tires on internal-combustion vehicles, per Michelin and corroborated by JD Power.
- OE tire satisfaction scored 769 (out of 1,000) for EV owners versus 796 for ICE owners — a 27-point gap that widened year-over-year.
- EVs accounted for 9.2% of new U.S. retail vehicle registrations in 2024, with roughly 1.3 million new EVs sold.
- EVs are 10–30% heavier than comparable ICE vehicles — the primary driver of accelerated tire wear.
- Flatbed tows are 3× more common for electric vehicles than for ICE vehicles, and more than 85% of EV roadside events require a tow.
- California (22.9%) and Colorado (20.5%) led U.S. states for EV registration share in Q2 2025.
- EVs represent approximately 1.9% of the 291 million vehicles on U.S. roads at end of 2025, up from 1.4% in 2024 — a fast-growing but still small installed base.
Table of Contents
- EV Tire Market Size & Forecasts
- EV Adoption Driving Tire Demand
- Why EV Tires Wear Faster
- EV Tire Satisfaction & JD Power Data
- EV-Specific Tire Models & OEM Launches
- EV Tires vs. ICE Tires — Performance Comparison
- EV Roadside Assistance & Flat Tire Impact
- EV Tire Pricing & Replacement Cycle
- Regional EV Adoption Statistics
- Frequently Asked Questions
- Methodology & Sources
EV Tire Market Size & Forecasts
The EV tire market is one of the fastest-growing segments of the global tire industry, with the most-cited forecast from MarketsandMarkets projecting a 13.6% CAGR through 2032 — roughly triple the growth rate of the overall tire market.
- The global EV tire market was valued at $11.21 billion in 2025 and is projected to reach $27.63 billion by 2032, growing at a CAGR of 13.6%.
- Growth is driven by surging EV adoption across passenger and commercial segments, OEM integration of EV-specific tires as standard fitment, and low-noise compound innovation.
- By comparison, the global passenger tire market was valued at $143.4 billion in 2025 and is projected to reach $191.2 billion by 2032 — a 4.2% CAGR, less than one-third the rate of the EV tire segment.
- Forecasts from different firms vary widely — Coherent Market Insights projects $4.18B → $16.91B at 22.1% CAGR, Spherical Insights projects $114.84B by 2032 at 24.8% CAGR, and Towards Automotive projects $26.81B → $59.59B at 9.28% CAGR (2024-2034).
- Off-road and commercial EV applications — particularly electric pickups like the F-150 Lightning and Cybertruck — are the fastest-growing sub-segment within the EV tire market through 2032.
EV Adoption Driving Tire Demand
EV tire demand tracks EV registrations directly. The U.S. installed base of EVs is small but fast-growing, and the share of new vehicle sales is now in the high single digits — enough to make EV-specific tire SKUs a strategic priority for every major manufacturer.
- EVs accounted for 9.2% of all new U.S. retail vehicle registrations in 2024 — roughly 1.3 million new EVs sold.
- In 2025, EVs represented 7.4% of new U.S. passenger car and light truck registrations — down from a record 8% in 2024 — following the early end of federal IRA consumer incentives.
- EVs represent approximately 1.9% of the 291 million vehicles on U.S. roads at end of 2025, up from 1.4% in 2024.
- Battery EVs represent 11% of new light-duty vehicle sales over the trailing 12 months as of 2025; total alternative-fuel vehicles (BEV + hybrid + PHEV) account for 38.6%.
- EVs represent 9.5% of new light-duty vehicle sales in Q2 2025, down from 10.9% in Q4 2024 — the first year-over-year quarterly decline since 2020.
Why EV Tires Wear Faster
EV tires wear faster for three structural reasons: heavier curb weight from the battery pack, instant peak torque from the electric motor, and aggressive acceleration patterns from drivers who exploit the available torque. The wear differential is consistently 15–30% across studies from Michelin, JD Power, and tire industry analyses.
- EV tires wear up to 20% faster than tires on traditional internal-combustion vehicles, per Michelin.
- EVs are 10–30% heavier than comparable ICE vehicles — a 2024 Hyundai Kona EV weighs 3,758 lbs versus 3,053 lbs for the gas Kona, a 705-lb (23%) increase.
- The Ford F-150 Lightning carries an 1,800-pound (820 kg) battery pack — most of the EV's added curb weight versus the ICE F-150 comes from the battery alone.
- EV electric motors deliver 100% of peak torque from zero RPM, accelerating the vehicle harder off the line and producing higher slip-induced tread wear than typical gasoline acceleration.
- Driver behavior compounds the problem — EV drivers are tempted to use the available torque, producing more aggressive launches that further accelerate tire wear.
- Specialized EV tires (e.g., Michelin Pilot Sport EV) deform only 5.2 mm under an 800-kg load compared to 12.1 mm for non-EV tires — a stiffer carcass designed for the higher per-tire load.
EV Tire Satisfaction & JD Power Data
The most authoritative EV tire satisfaction data is the JD Power U.S. Original Equipment Tire Customer Satisfaction Study, which has tracked EV vs. ICE satisfaction since 2022. The 2024 wave (fielded August–December 2023, n=31,414 owners of model-year 2022–2023 vehicles) confirmed a widening EV satisfaction gap driven by tire wear.
- EV owners scored their OE tires 769 on a 1,000-point satisfaction scale; ICE owners scored 796 — a 27-point gap that widened year-over-year.
- The 2024 JD Power survey was based on 31,414 owners of 2022 and 2023 model-year vehicles, fielded August–December 2023.
- Tire wear is the dominant driver of the EV satisfaction gap — EV owners expect ICE-like tire life but typically get 15–30% less.
- Top OE tire brands by 2024 JD Power rank — Luxury: Michelin (1st), Goodyear (2nd), Continental (3rd). Passenger car: Michelin (1st), Goodyear (2nd), Kumho (3rd). Truck: Falken (1st), BFGoodrich (2nd), Hankook (3rd).
- JD Power identifies the satisfaction gap as a communication failure — tire manufacturers and automakers have an opportunity to educate EV owners on inherent performance differences.
EV-Specific Tire Models & OEM Launches
Tier-1 tire manufacturers have responded to the EV wear and noise challenge with EV-specific product lines designed for higher load capacity, lower rolling resistance, and quieter operation. Most launched their first EV-specific consumer tire between 2021 and 2024.
- Bridgestone launched the Turanza EV grand-touring tire in 2023, designed specifically for the Tesla and Ford Mustang Mach-E; additional sizes for other EVs launched in early 2024.
- Michelin launched the Pilot Sport EV as its first summer EV-specific high-performance tire in 2021–2022, with a UTQG treadwear rating of 320.
- Michelin's 2026 EV tire range expansion (Primacy / Pilot Energy) promises up to 10% more range than competitors.
- Goodyear's ElectricDrive GT2 is an ultra-high-performance all-season EV tire featuring low rolling resistance, 50% recyclable materials, and a 45,000-mile treadwear warranty.
- Major manufacturers Michelin, Bridgestone, and Pirelli are increasingly integrating EV-specific tires as standard OE fitments — a key growth driver for the EV tire segment.
- Continental, Pirelli, Yokohama, Hankook, and Sumitomo all maintain dedicated EV tire product lines as of 2026 — EV-specific tires are now standard across every Tier-1 manufacturer.
EV Tires vs. ICE Tires — Performance Comparison
EV-specific tires differ from ICE-equivalent tires in five structural and compound dimensions: load index, rolling resistance, tread compound silica content, noise-cancellation foam, and sidewall stiffness. The performance differences are measurable and consistent across manufacturers.
- EV-specific tires require a higher load index to safely carry the additional curb weight of the battery pack.
- EV tires use specialized silica-heavy tread compounds engineered for high-load operation, low rolling resistance, and longer life under the EV duty cycle.
- Many EV tires include foam noise-cancellation rings inside the tire cavity to reduce road noise — critical in an EV cabin without engine noise to mask tire roar.
- Lower rolling resistance is a primary EV tire design goal — every 10% reduction in rolling resistance typically translates to roughly 1–2% gain in range, a meaningful trade-off in a battery-limited vehicle.
- Specialized EV tire carcasses deform only 5.2 mm under an 800-kg load, versus 12.1 mm for non-EV tires — a 57% reduction in deflection under EV-typical loads.
EV Roadside Assistance & Flat Tire Impact
The combination of heavier curb weight, no spare tire on most EV models, and battery-pack handling requirements has made flat tires the #1 EV roadside issue — and the most expensive to resolve. Agero's roadside data documents the structural difference between EV and ICE flat-tire response.
- Flatbed tows are 3× more common for electric vehicles than for ICE vehicles.
- More than 85% of EV roadside events require a tow.
- EV roadside events take approximately 18% longer (~12 minutes) to resolve than ICE roadside events.
- Customer satisfaction (NPS) drops nearly 20 points on average when an EV roadside event is poorly handled — a major retention risk for EV brands.
- In 2024, the rate of flat tires requiring a tow rose 6% year-over-year — driven largely by EVs and other newer vehicles arriving without a spare.
- Most EVs ship without a spare tire to preserve range — a key reason 85%+ of EV flats require a tow.
EV Tire Pricing & Replacement Cycle
EV tires cost more than equivalent ICE tires at point of purchase, and the shorter replacement cycle (driven by 15–30% faster wear) compounds the total tire-spend differential over the EV's life. There is no single authoritative dataset on EV tire price premiums; the figures below combine manufacturer disclosures, retailer pricing, and tire-press reporting.
- Goodyear's ElectricDrive GT2 EV tire carries a 45,000-mile treadwear warranty — shorter than typical ICE all-season tires (60,000–80,000 miles).
- EV tire wear differential of 15–30% means an EV owner who would replace ICE tires at 60,000 miles will replace EV tires at 42,000–51,000 miles instead.
- Bridgestone's Turanza EV launched with a price premium over its non-EV Turanza counterpart, reflecting the higher load index, noise-cancellation foam, and silica-tread compound.
- Most EVs ship without a spare tire, so EV owners face higher unscheduled tire-replacement costs (full-tire replacement at retail rather than spare swap + cheaper repair).
Regional EV Adoption Statistics
U.S. EV adoption — and therefore EV tire demand — is highly concentrated geographically. California alone accounts for a disproportionate share of national EV registrations, with Colorado, Washington, and other coastal states following.
- California led the U.S. in EV registration share at 22.9% of all new vehicle registrations in Q2 2025.
- Colorado ranked second at 20.5% EV share of new vehicle registrations in Q2 2025.
- The national average for new-vehicle EV share in 2025 was approximately 7.4%, meaning California and Colorado are running at roughly 3× the national rate.
- Total U.S. EV installed base reached approximately 5.5 million vehicles by end of 2025 (1.9% of 291 million vehicles on the road), up from approximately 4 million at end of 2024.
- State-level EV tire demand correlates directly with state EV registration share — California, Colorado, Washington, and Oregon collectively account for a disproportionate share of EV-specific tire SKU sales.
Frequently Asked Questions
How big is the EV tire market in 2026?
Do EV tires wear out faster than regular tires?
What is the average lifespan of an EV tire?
Which tire brands make EV-specific tires?
Why don't most EVs come with a spare tire?
Are EV tires more expensive than regular tires?
What percentage of new U.S. vehicles are EVs?
Which states have the highest EV adoption?
Related Topics
Continue exploring tire data:
- Tire Industry Statistics 2026: 50+ Key Stats You Need to Know — comprehensive hub of all tire industry data.
- Tire Market Size & Revenue Statistics 2026 — global and U.S. tire market valuations, revenue, and forecasts.
- Tire Recycling & Environmental Statistics 2026 — end-of-life tire management, scrap tire markets, and sustainability data.
- Tire Brand Market Share 2026 — global tire brand rankings and revenue share by manufacturer.
- Tire Price Statistics 2026 — average tire prices by tier, size, and brand — plus inflation trends.
Methodology & Sources
Data in this article was compiled from authoritative public sources between 2022 and 2034. Sources include government agencies, industry associations, publicly traded company financial filings, and recognized market research firms. Revenue figures are reported in current-year USD unless otherwise noted. We update annually; if you find a stat that has changed, please reach out.
EV Tire Market Size & Forecasts
EV Adoption Driving Tire Demand
- Experian Insights, 2025, 2025
- S&P Global Mobility, 2025, 2025
- Alliance for Automotive Innovation, Q2 2025, 2025
Why EV Tires Wear Faster
- Michelin via WardsAuto / JD Power
- InsideEVs, 2024, 2024
- Wikipedia / Charge Rigs
- Motor1, 2025, 2025
- Wheel-Size.com
EV Tire Satisfaction & JD Power Data
- JD Power 2024 U.S. OE Tire Customer Satisfaction Study, 2024
- JD Power 2024 OE Tire Study, 2024
- JD Power / CleanTechnica
- JD Power 2024, 2024
- JD Power / Auto Remarketing
EV-Specific Tire Models & OEM Launches
- Tesla Owners Online / Bridgestone, 2024
- Tire Lab / Tesla Motors Club, 2022
- Carscoops, 2026, 2026
- CarPro / Goodyear
- MarketsandMarkets, 2025, 2025
- Tire Review, 2026
EV Tires vs. ICE Tires — Performance Comparison
EV Roadside Assistance & Flat Tire Impact
EV Tire Pricing & Replacement Cycle
Regional EV Adoption Statistics
Driving an EV and shopping for replacement tires? Search SearchTires by tire size or vehicle to compare drive-out prices on EV-specific tires near you. For more SearchTires research in this series: Tire Industry Statistics 2026: 50+ Key Stats You Need to Know, Tire Safety & Blowout Statistics 2026, Tire Recycling & Environmental Statistics, and Flat Tire Statistics.
© 2026 SearchTires.com. This page may be cited with attribution. If you use our data in a publication or article, please link back to this page as the source.