Tire Recycling and Environmental Statistics
50+ tire recycling and environmental stats for 2026: a 79% U.S. recycling rate, ~1 billion end-of-life tires a year, tire-derived fuel, and pyrolysis.
Tire Recycling & Environmental Statistics 2026: 50+ Stats on Waste, Reuse & Impact
Last updated: May 2026 · Reviewed annually
Every year the world produces roughly 2.5 billion new tires and retires another 1 billion to scrap heaps, landfills, recyclers, and burn piles. In the United States alone, 250 million tires hit end-of-life annually — and 79% of them now find a second life as tire-derived fuel, ground rubber, modified asphalt, or recovered carbon black. Yet the environmental footprint is wider than the recycling numbers suggest: tire wear is a major source of microplastic pollution, contributing an estimated 5–10% of the plastic entering the world's oceans. This page compiles the most important tire recycling and environmental statistics for 2026 — all sourced and cited. This in-depth report is part of our Tire Industry Statistics 2026 series — a 50+-stat overview of the entire U.S. tire industry.
Key Findings
- 1 billion end-of-life tires are generated globally each year, on a base of ~2.5 billion tires produced annually worldwide.
- 79% of U.S. end-of-life tires recycled or reused in 2023 — a 10.5% increase from prior reporting, on a base of 250 million scrap tires annually.
- 33% of U.S. scrap tires consumed as tire-derived fuel (TDF) in 2023, with cement kilns the largest end-user at 51%.
- 28% of U.S. ELTs flow into ground rubber — up 29% since 2019 and now the fastest-growing end-market.
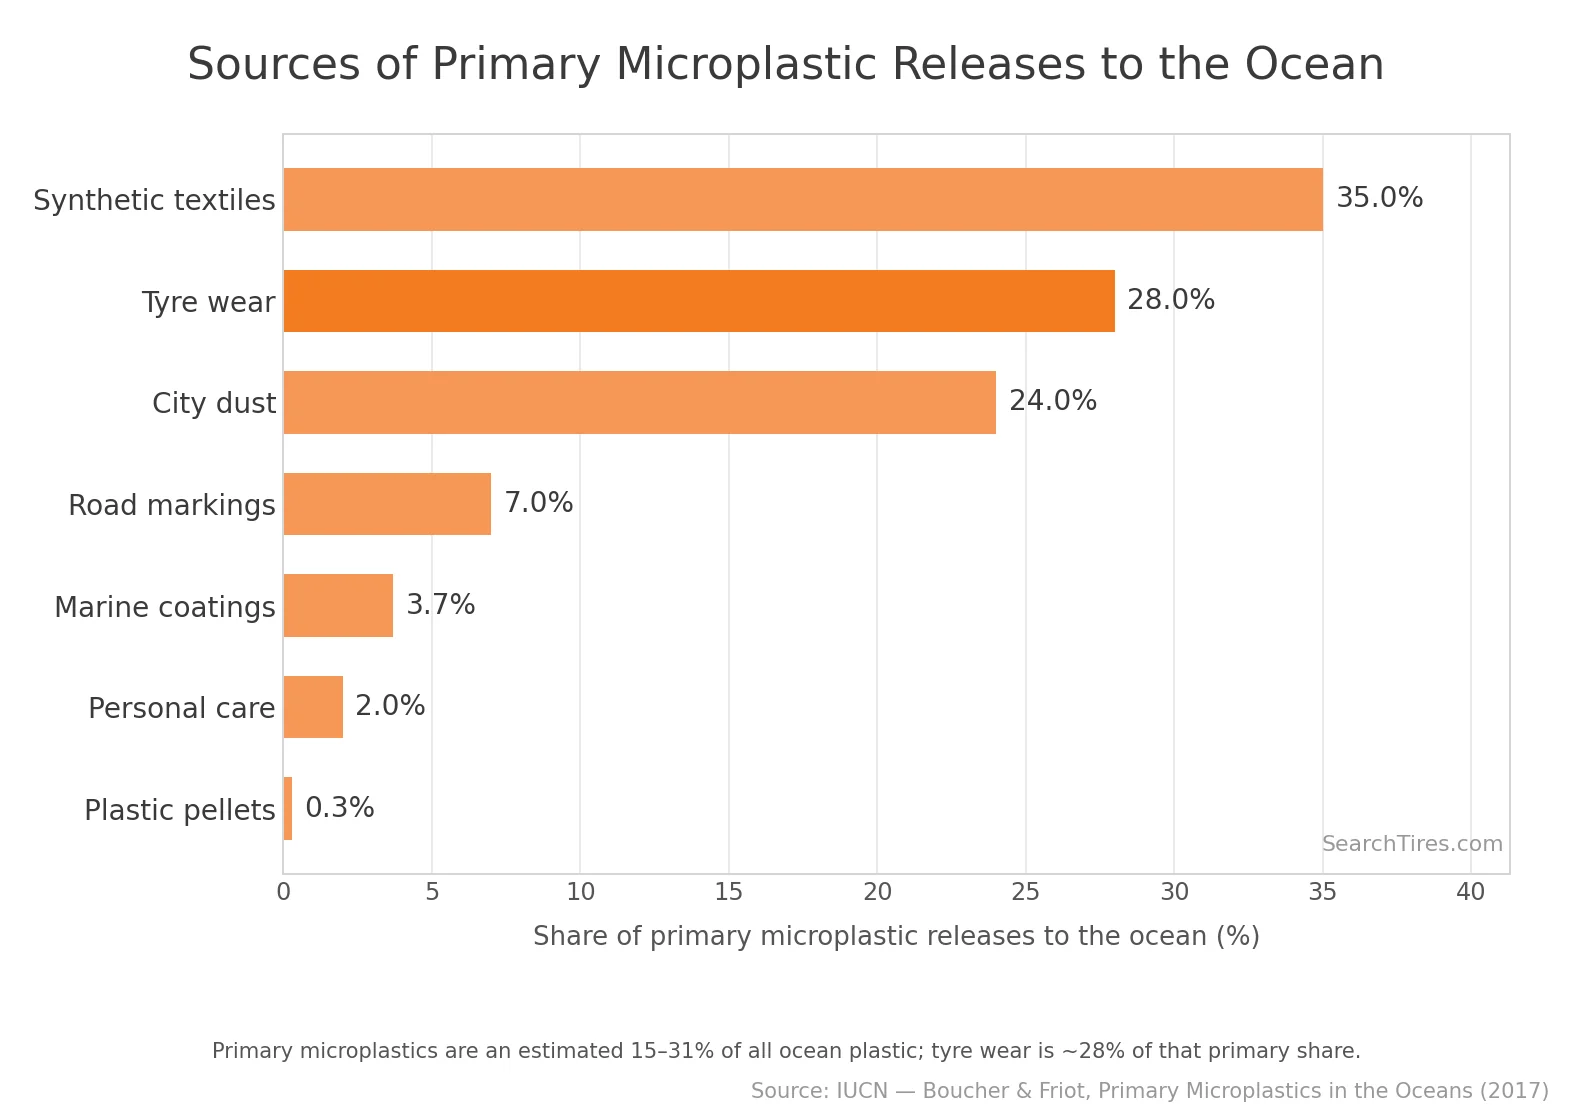
- Tire wear is ~28% of primary microplastic releases to the ocean (IUCN, 2017).
- 97% European tire treatment rate, with material-recovery share rising from 10% to 60% over recent years.
- $2.3 billion to $4.8 billion tire pyrolysis market projected 2024→2033 at an 8.7% CAGR, driven by recovered carbon black demand.
- Just under 48 million end-of-life tires remain in U.S. stockpiles — down from over 1 billion four decades ago.
📑 Table of Contents
- End-of-Life Tire Volume Statistics
- U.S. Tire Recycling Rates & Trends
- Tire-Derived Fuel (TDF) Statistics
- Ground Rubber & Crumb Rubber Statistics
- Rubber-Modified Asphalt (RMA) Statistics
- Tire Pyrolysis & Recovered Carbon Black
- Global Tire Recycling Comparisons
- Tire Microplastics & Environmental Impact
- Tire Stockpiles & State-Level Cleanup
- Frequently Asked Questions
- Methodology & Sources
End-of-Life Tire Volume Statistics
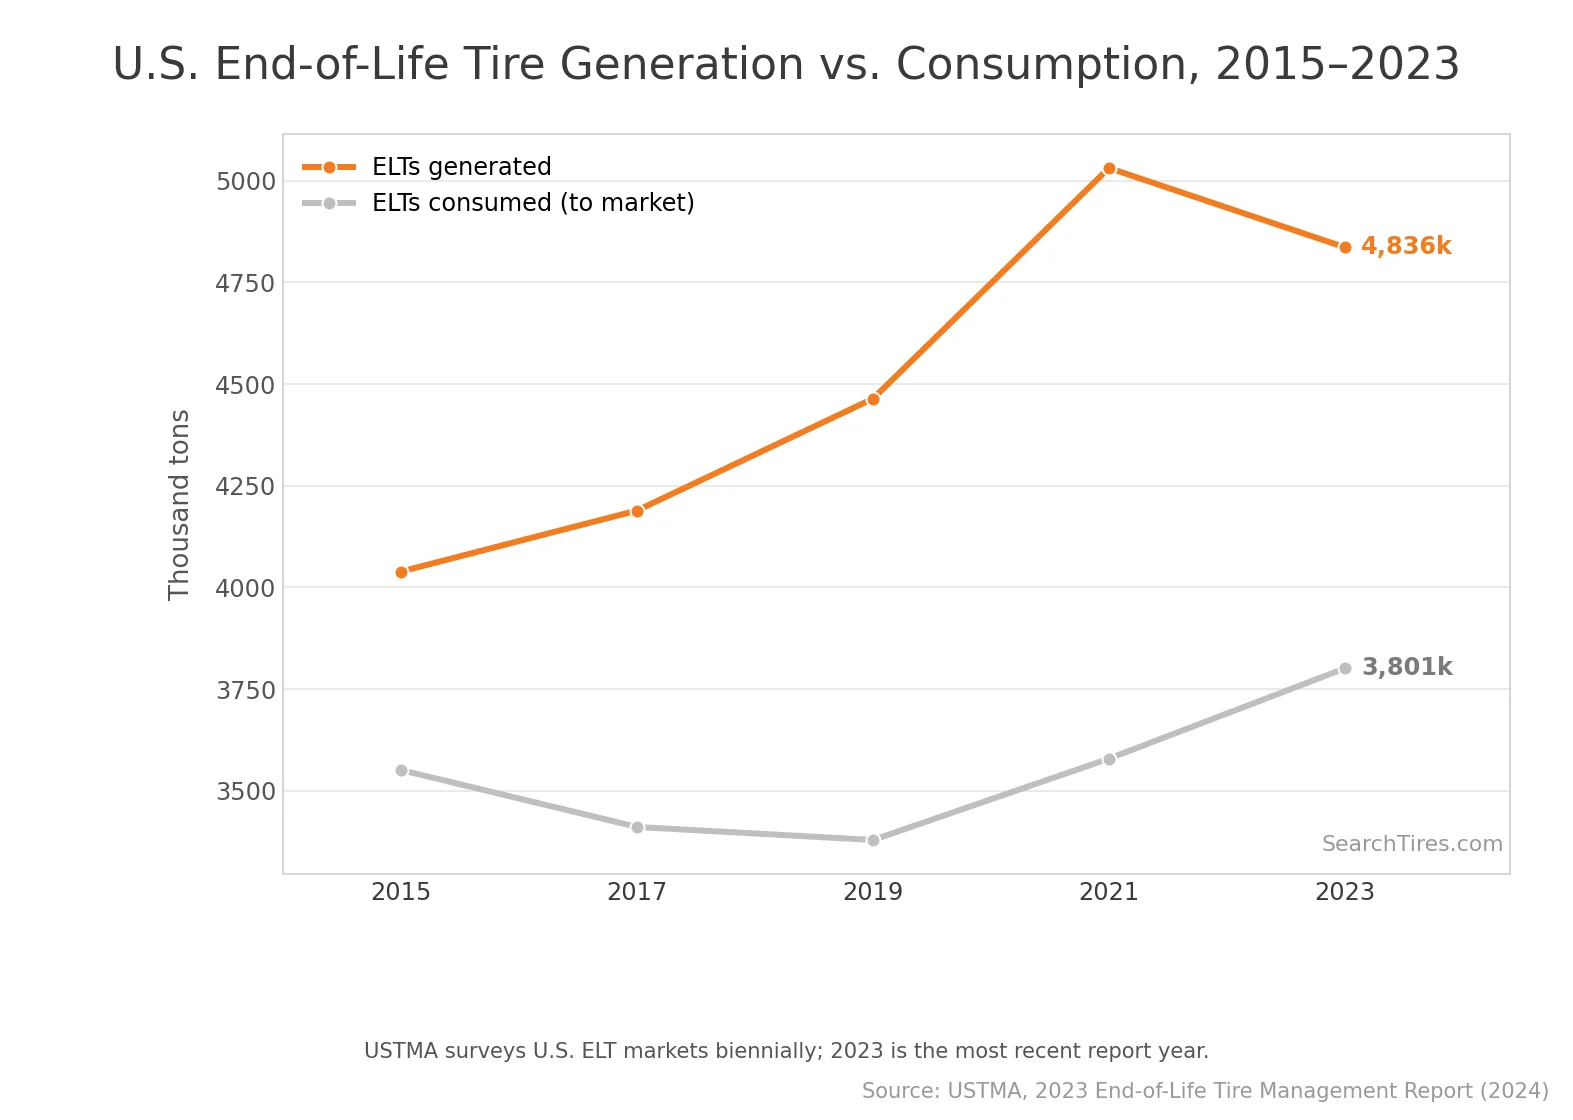
Tire production and end-of-life volume have grown roughly in step over the past decade. Global manufacturing now generates more scrap tires per year than any other rubber-product category combined, creating a multi-billion-dollar logistics and recycling industry.
- Approximately 2.5 billion tires are produced worldwide annually, based on production trends rising from 2.27 billion units in 2021.
- An estimated 1 billion end-of-life tires are generated globally each year — a number that has held roughly steady as production-replacement cycles balance.
- The United States generates approximately 250 million scrap tires annually, the largest single-country ELT stream in the world.
- Europe generated 3.9 million tonnes of end-of-life tires in 2024, with effectively 100% of collected ELTs entering some form of treatment.
- The U.S. tire industry shipped 337.4 million units in 2025 — most of which will become end-of-life tires within 5 years.
- Global scrap tire generation is rising 2–3% annually, tracking population, vehicle ownership, and the EV transition (which compresses replacement cycles).
- State tire-disposal fees collected at point-of-sale typically range from $1 to $3 per tire, funding state-level recycling programs, stockpile cleanup, and illegal-dumping enforcement.
U.S. Tire Recycling Rates & Trends
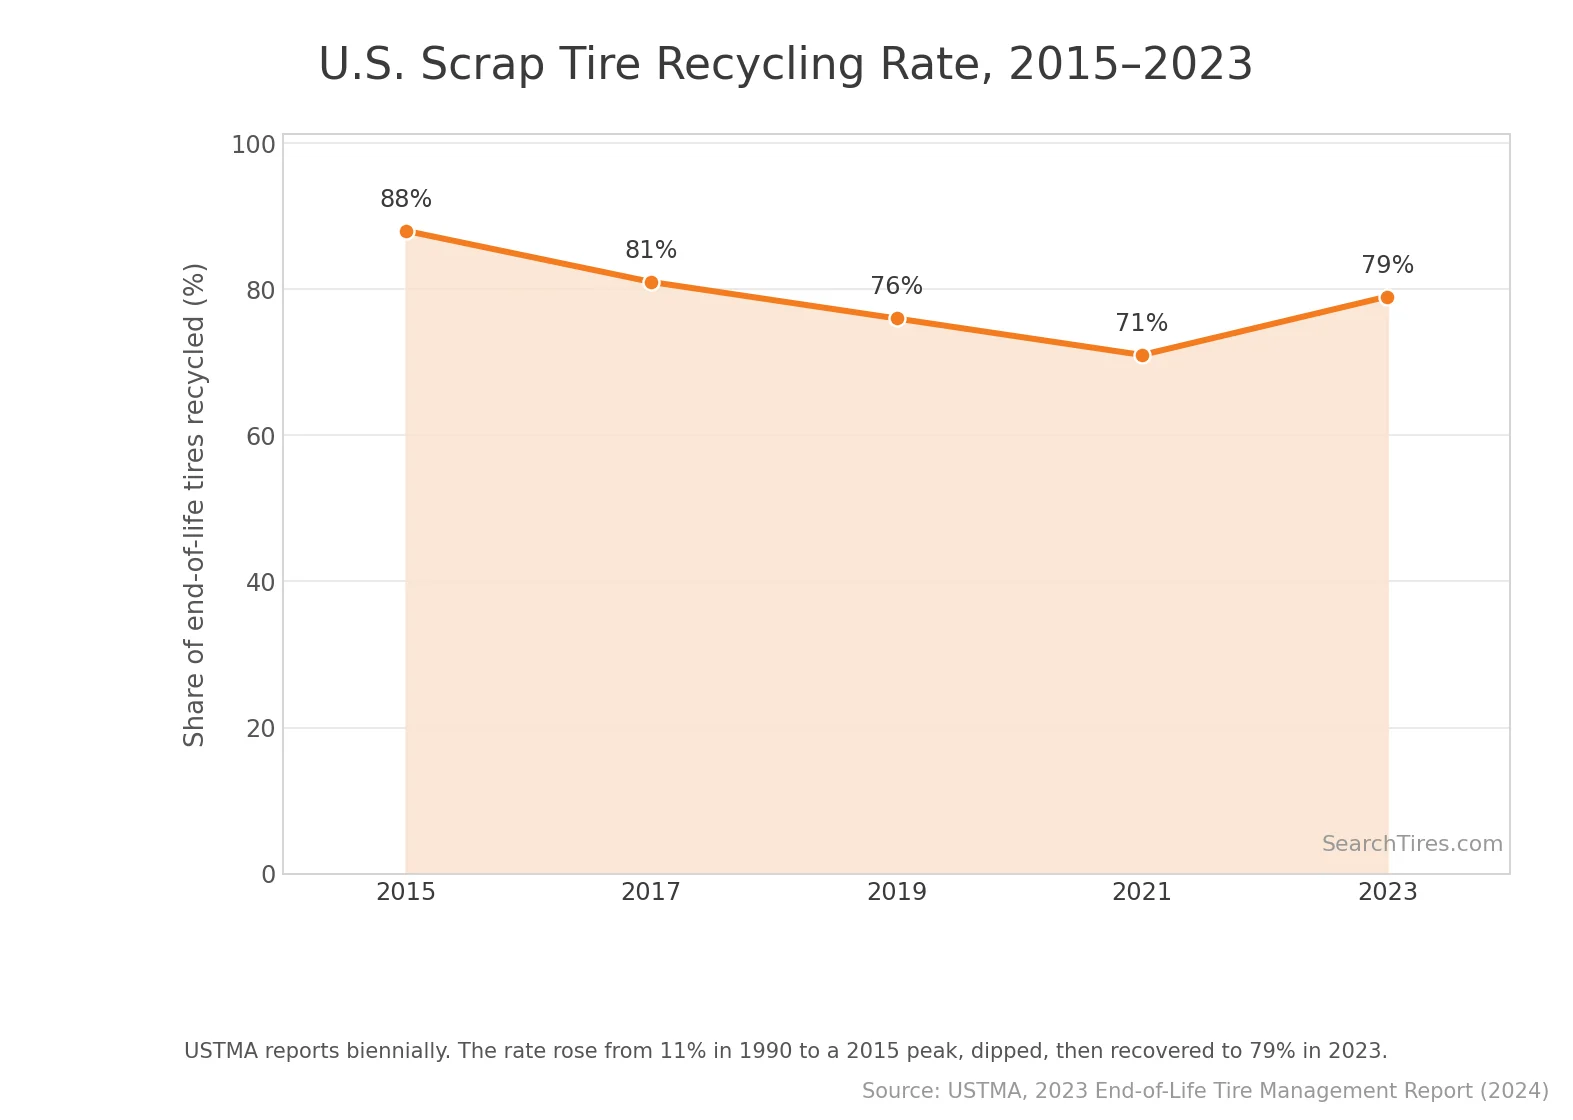
The U.S. tire-recycling rate has improved dramatically over four decades, from near-zero in the 1980s to 79% in 2023. USTMA's biennial End-of-Life Tire Management Report is the authoritative U.S. benchmark.
- 79% of U.S. end-of-life tires were recycled or reused in 2023, up from 71% in the prior reporting period — a 10.5% increase.
- Tires are one of the most recycled and reclaimed consumer products in the United States — outpacing metal, glass, aluminum, plastic, and paper.
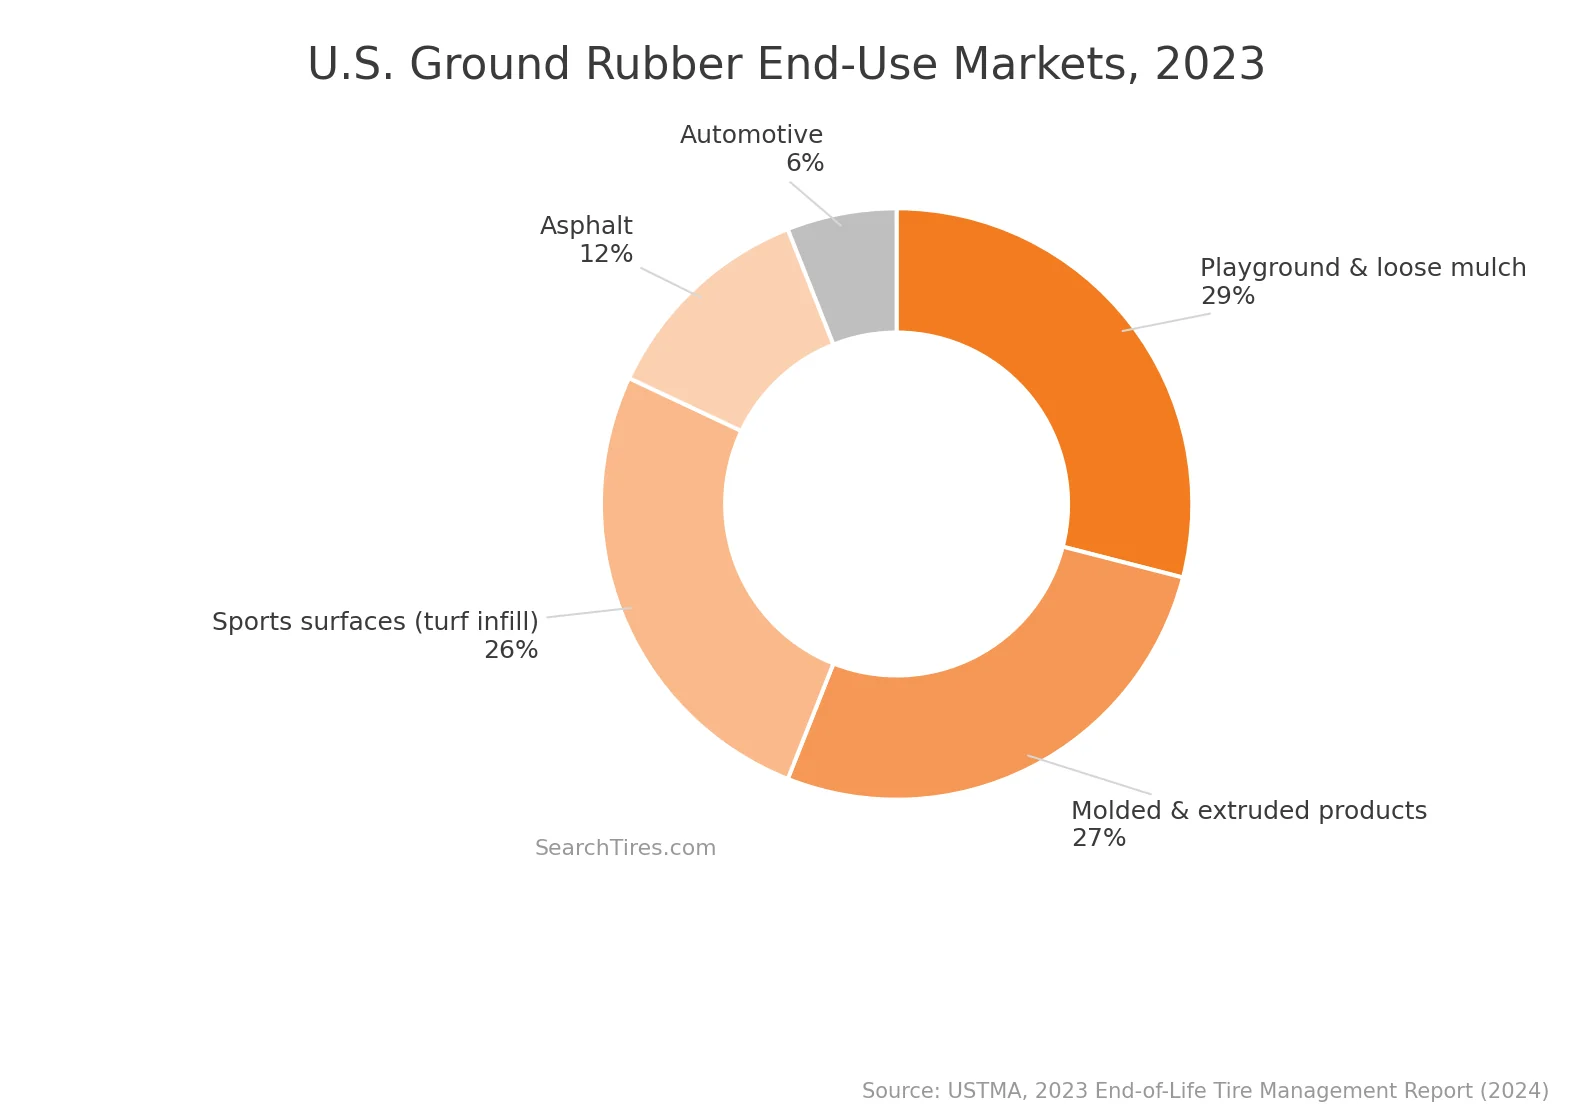
U.S. ELT End-Use Market Share (2023)
- Civil engineering applications (drainage, septic systems, lightweight fill) historically consumed 7–8% of U.S. ELTs but have declined as ground rubber and RMA expanded.
- The remaining 21% of U.S. ELTs flow into landfill, stockpiles, or other uncategorized disposal — a category USTMA targets for ongoing reduction.
- USTMA's 11 member companies operate 55 tire-related manufacturing facilities in 16 U.S. states, plus a network of recycling and remanufacturing partners.
- The Tire Recycling Foundation, launched by USTMA and the Tire Industry Association (TIA) at the 9th Tire Recycling Conference in May 2024, secures funding for research, education, and demonstration projects targeting U.S. recycling supply-chain gaps.
Tire-Derived Fuel (TDF) Statistics
Tire-derived fuel — shredded tires combusted in cement kilns, pulp and paper mills, and electric utility boilers — has been the largest single end-market for U.S. scrap tires since the 1990s. TDF produces 25% more energy per pound than coal and burns cleaner than most conventional fuels.
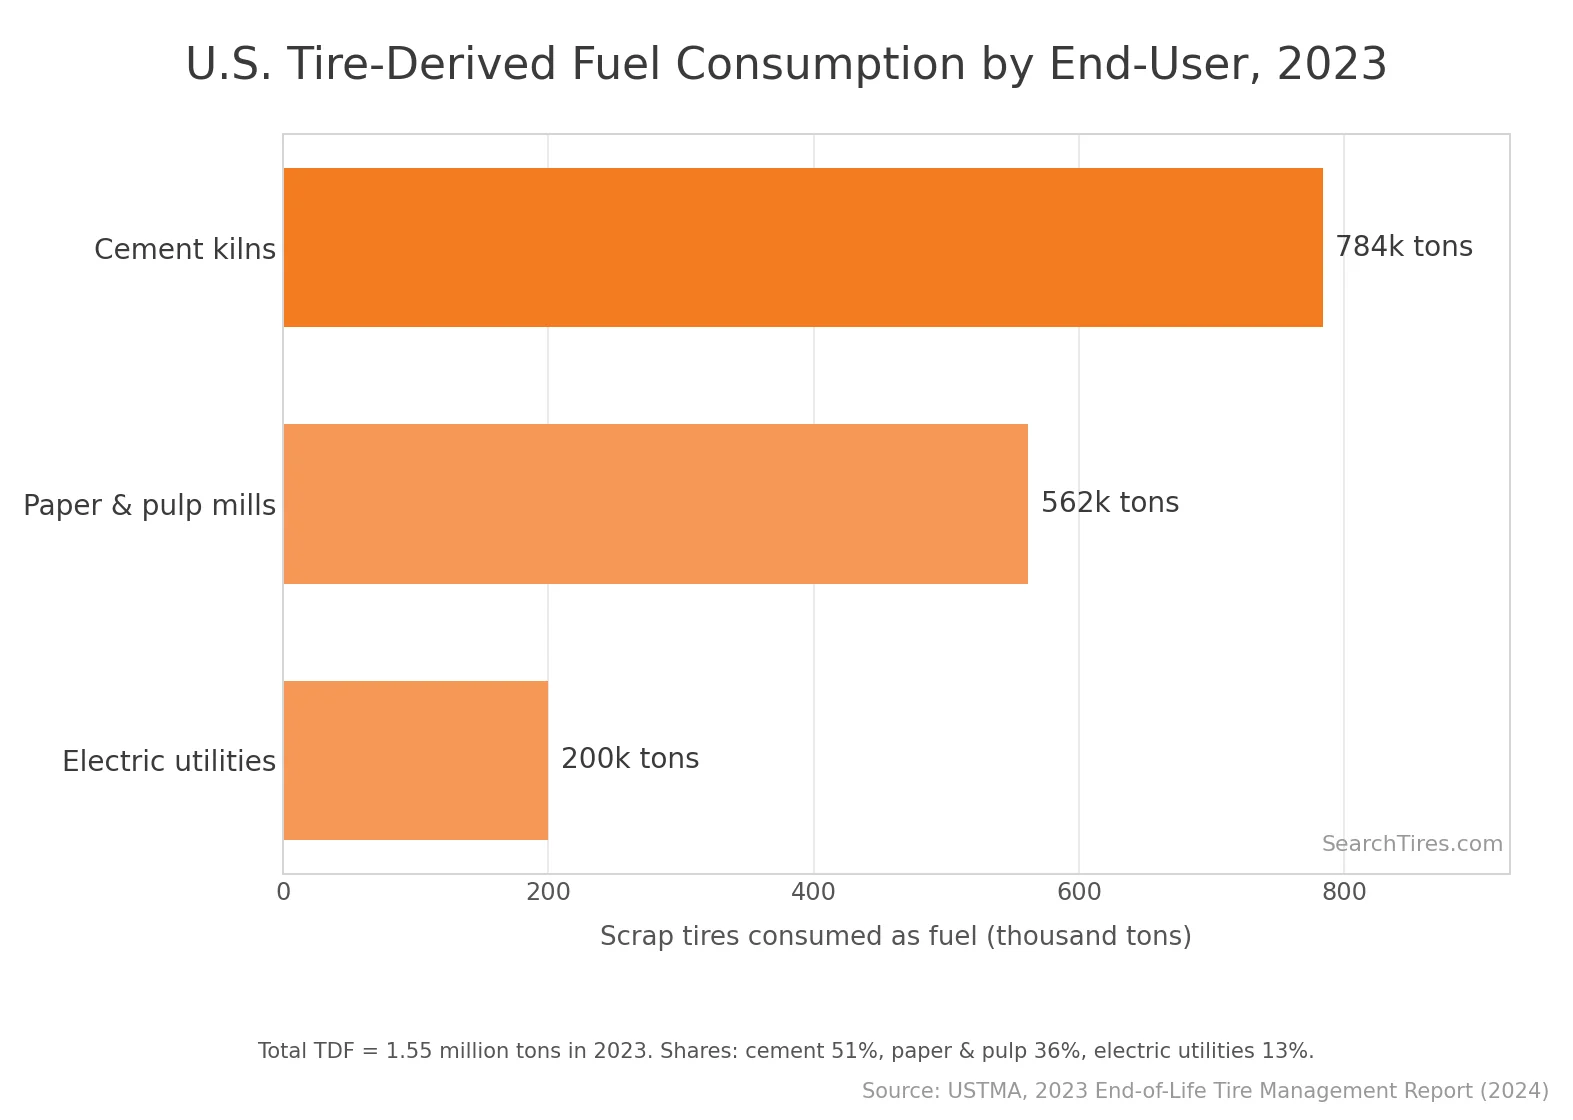
- TDF consumed approximately 1.55 million tons of scrap tires in 2023, equivalent to about 84 million end-of-life tires.
- Cement kilns account for 51% of U.S. TDF consumption, with paper and pulp mills at 36% and electric utilities at 13%.
- Leading cement manufacturers — Holcim, HeidelbergCement, and CEMEX — substitute up to 30–40% of their thermal fuel requirements with TDF at facilities where state regulatory approvals permit.
- TDF produces ~12,500 BTU per pound versus ~10,000 BTU per pound for coal — a 25% energy density advantage.
- Sulfur and metal emissions from TDF are typically lower than from coal, with proper combustion temperature management.
- The U.S. TDF market is forecast to grow at a 3.02% CAGR through 2029, driven by cement-industry decarbonization commitments and fossil-fuel substitution targets.
- TDF combustion is regulated under Clean Air Act Section 129 for solid-waste incineration units; specific state permits govern emissions limits.
Ground Rubber & Crumb Rubber Statistics
Ground rubber — crumb rubber produced by mechanical shredding and grinding of tires — is the second-largest end-market and the fastest-growing. Crumb rubber is used in playgrounds, athletic fields, asphalt modification, molded products, and automotive components.
- Ground rubber consumed 28% of U.S. end-of-life tires in 2023 — the second-largest end-market after TDF.
- Ground rubber consumption increased 29% since 2019, the fastest-growing end-market in the ELT category.
- Approximately 1.5 million tons of crumb rubber are produced in the U.S. annually, across granular and powder size grades.
- Synthetic turf athletic fields are the most visible crumb rubber application, with thousands of installations across U.S. K-12 schools, universities, and professional facilities.
- Playground surfacing is another major crumb rubber market, with rubber-mulch and poured-in-place surfaces installed in tens of thousands of public playgrounds nationwide.
- Molded crumb rubber products include wheels (carts, dustbins, lawnmowers), shock-absorbing mats (stables, schools), paving blocks, urban furniture, and roofing materials.
- The global tire recycling market is forecast at $7.44 billion in 2024, growing to $8.92 billion by 2029 at a 3.7% CAGR.
Rubber-Modified Asphalt (RMA) Statistics
Rubber-modified asphalt blends ground tire rubber with conventional asphalt binder, producing pavement that is quieter, longer-lasting, and lower-carbon than standard asphalt. RMA is a USTMA-led market-expansion priority for 2024–2026.
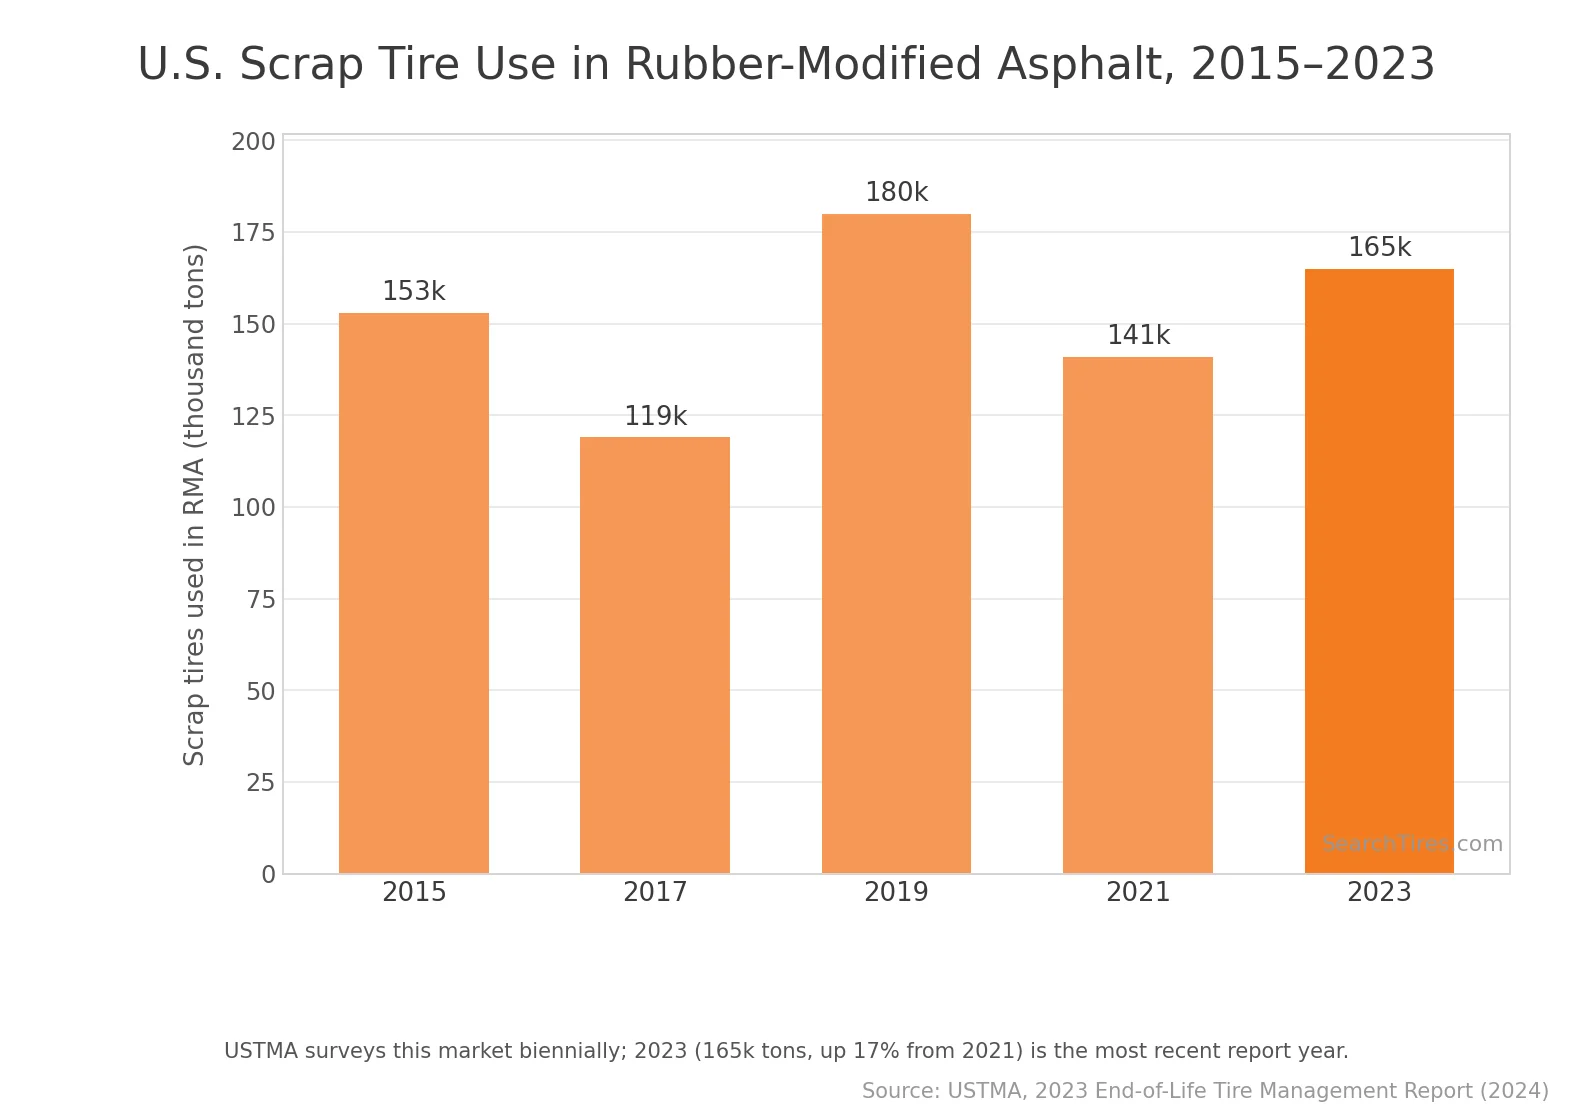
- Since 2021, RMA has consumed 165,000 tons of U.S. end-of-life tires — a 17% increase compared to prior periods.
- RMA-paved roads have demonstrated extended pavement lifespans, enhanced skid resistance, improved ride quality, and reduced traffic noise compared to standard asphalt.
- RMA's superior water permeability reduces spray in wet driving conditions, contributing to safer wet-weather travel.
- RMA reduces CO₂ emissions, tire-and-road wear particles, and rolling resistance — lowering both lifecycle pavement emissions and the fuel consumption of vehicles driving on it.
- The USTMA Tire Recycling Foundation, launched in May 2024, includes a nationwide push for RMA adoption as a primary funding priority.
- California, Arizona, and Texas have led U.S. state RMA adoption for decades, with documented pavement-life and noise-reduction benefits informing the national rollout push.
- The State of Knowledge Report on Rubber Modified Asphalt (USTMA, 2024) is the canonical U.S. reference for engineering specifications, lifecycle costs, and environmental benefits of RMA pavement.
Tire Pyrolysis & Recovered Carbon Black
Pyrolysis — thermal decomposition of tires in oxygen-free conditions — recovers carbon black, oil, gas, and steel as separable feedstocks. It is the fastest-growing tire-recycling technology globally and the route most aligned with the circular-economy goal of producing new tires from old.
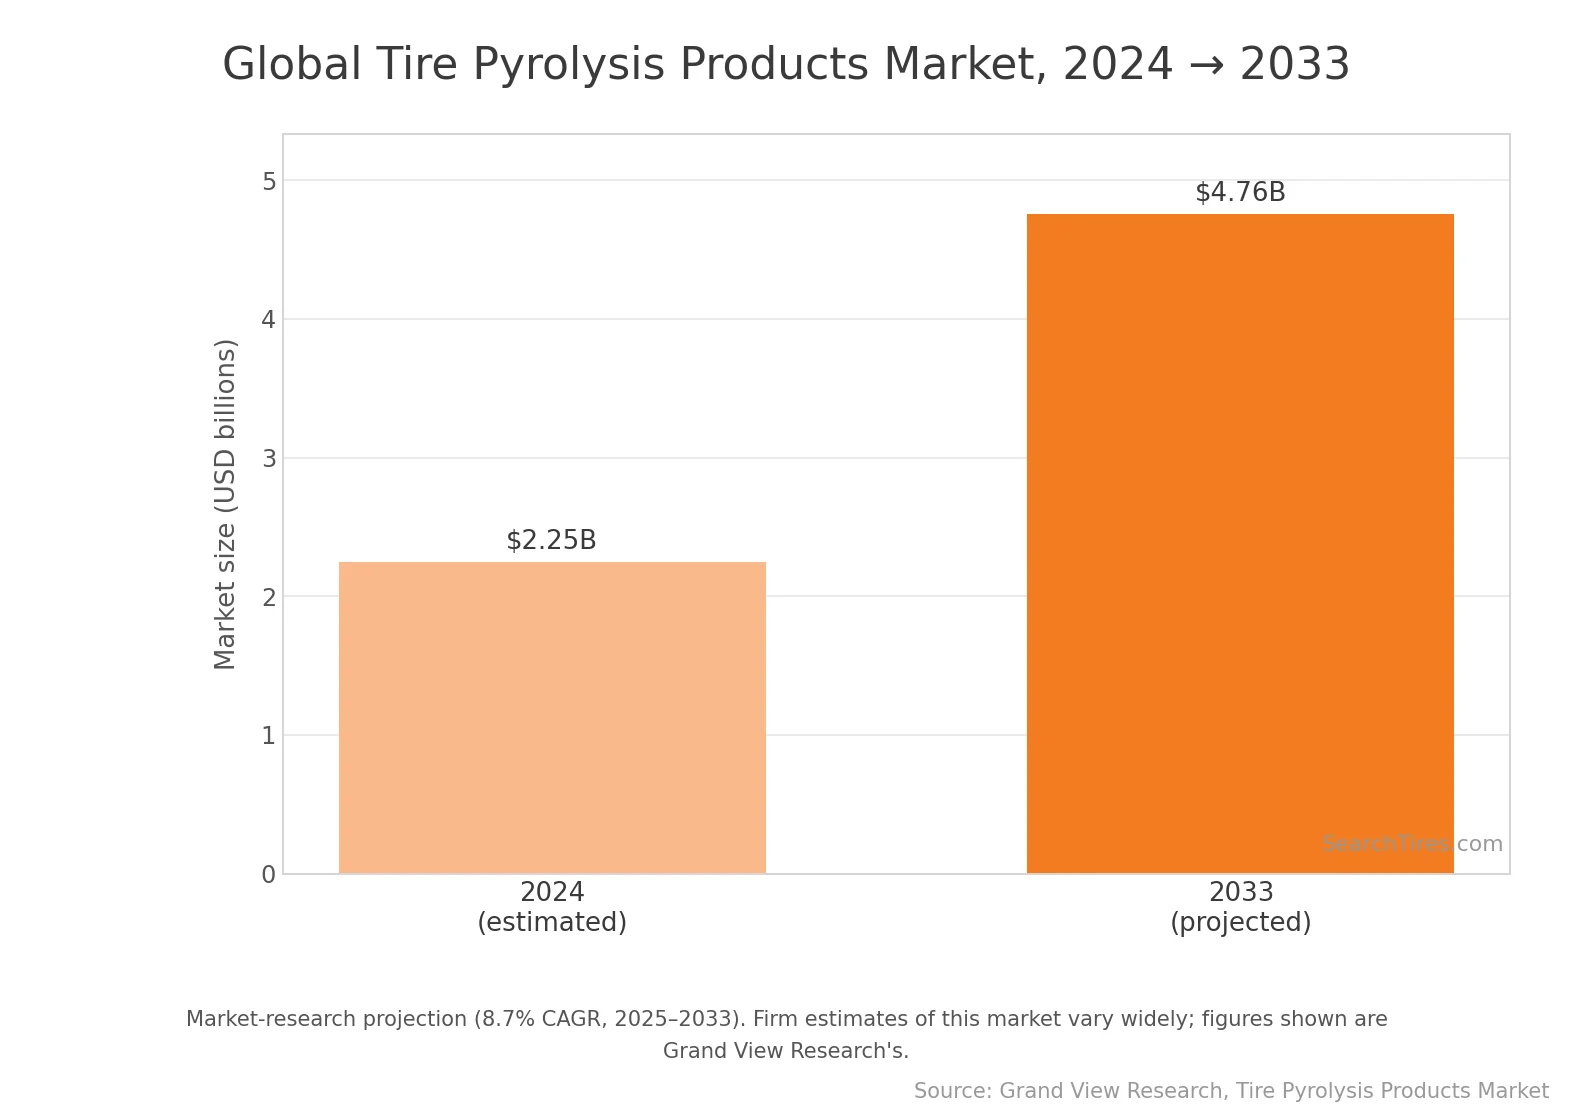
- The global tire pyrolysis products market was an estimated $2.3 billion in 2024 and is projected to reach $4.8 billion by 2033 at an 8.7% CAGR.
- The global recovered carbon black (rCB) market reached $91 million in 2025, on track for substantial near-term expansion as rCB displaces virgin carbon black in tire manufacturing.
- Global recycled carbon black production is projected to reach 1.2 million tons in 2026, a 38% increase from 2025, driven by equipment efficiency gains and capacity expansion.
Recovered Carbon Black Market Share by Region (2025)
- Pyrolysis recovers four product streams from each tire, with typical yields of 35–45% pyrolysis oil (used as a petrochemical feedstock or fuel), 30–40% recovered carbon black (rCB), 10–15% steel wire, and 8–15% gas — exact ratios vary by feedstock composition and reactor conditions.
- The chemical manufacturing segment is the fastest-growing pyrolysis end-use, with a 13.9% CAGR forecast through 2033 as tire pyrolysis oil (TPO) feeds solvent and specialty-chemical production.
- rCB carries a much lower carbon footprint than virgin carbon black (which is produced from heavy petroleum fractions), making it a meaningful Scope-3 emissions tool for tire manufacturers with carbon-neutrality commitments.
Global Tire Recycling Comparisons
Tire recycling rates vary widely by country, driven by regulatory frameworks, landfill bans, EPR (Extended Producer Responsibility) schemes, and end-market development. Europe leads the developed world; emerging markets are catching up.
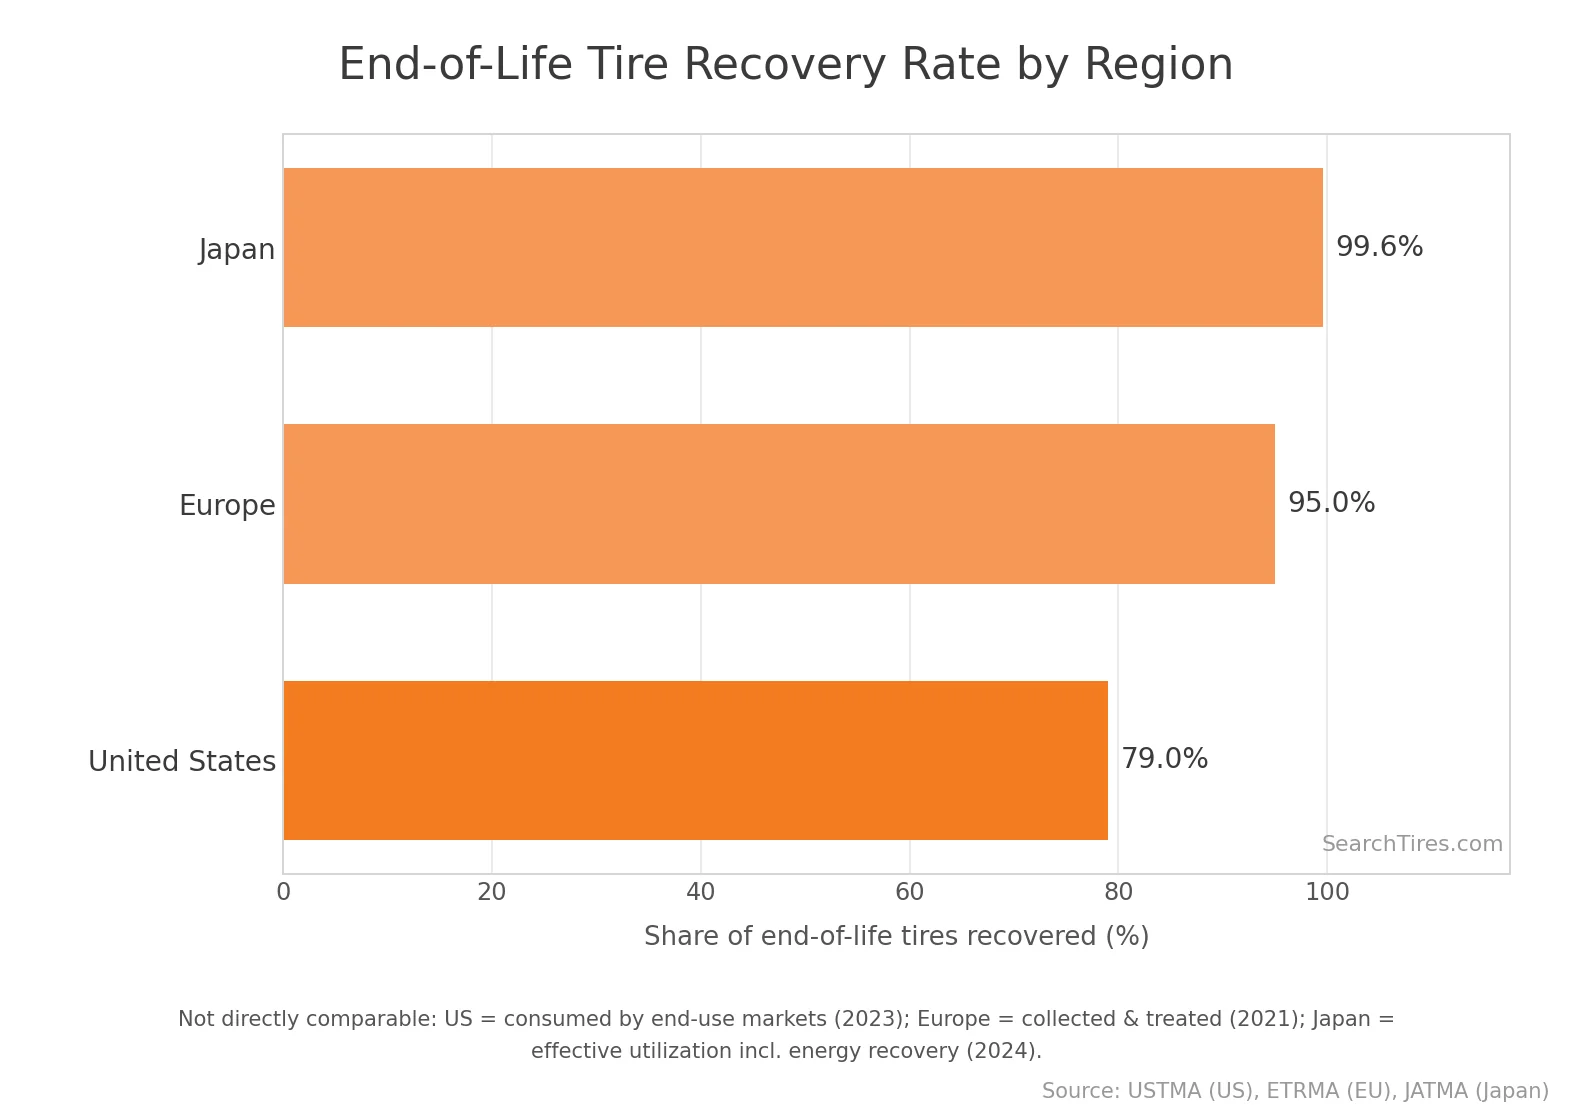
Tire Recycling Rate by Major Region
- Europe achieves a ~97% treatment rate for end-of-life tires (collected and treated), with effectively 100% of generated ELTs entering some form of management.
- European material-recovery share has risen from 10% to 60% over recent years, reflecting investment in mechanical recycling, RMA, and pyrolysis.
- Japan reports a 99.6% effective-utilization rate for end-of-life tires, among the highest nationally tracked rates, though it counts energy recovery.
- A single tire retreaded twice reduces 160 kg of waste and saves 104 kg of raw materials versus building two new tires.
- Approximately 35% of global waste tires are processed via formal recycling routes — the rest end up in landfill, informal disposal, or unregulated open burning, particularly in emerging markets.
- The Asia-Pacific region accounts for 45.3% of the global recovered carbon black market despite trailing on overall recycling rates — reflecting heavy investment in pyrolysis capacity.
Tire Microplastics & Environmental Impact
Tire wear has emerged in the past five years as a primary microplastic-pollution source, surpassing single-use plastics by some measurement frameworks. Tire-and-road-wear particles (TRWP) shed during driving carry both polymer microplastics and a chemical cocktail of additives into stormwater, soil, and ultimately oceans.
- Tire wear contributes an estimated 5–10% of the plastic entering the world's oceans, a peer-reviewed estimate of tire wear's marine footprint.
- Tire wear is roughly 28% of primary microplastic releases to the ocean, which are themselves an estimated 15–31% of all ocean plastic.
- Tire abrasion contributes one-third to one-half of all microplastics released unintentionally into the environment, per a 2024 systematic review of 671 published studies.
- 5–10% of plastics ending up in the world's oceans originate from tire wear, a smaller but still material contribution to total ocean plastic mass.
- Most microplastic particles in San Francisco Bay are tire-derived, per a San Francisco Estuary Institute sampling study.
- Tire wear particles transport into aquatic systems primarily via stormwater runoff and direct surface-water flow from roads.
- Aged tire wear particles have greater toxicological impact than fresh particles, with smaller particles releasing zinc and tire additives as they fragment.
- EPA, EU, and California Stormwater Permit Boards have all initiated regulatory review of tire-wear-particle emissions and runoff capture standards since 2023.
The microplastic angle is the most-cited tire environmental story in mainstream media — National Geographic, Yale E360, and Forbes have all run feature coverage of tire microplastics since 2020.
Tire Stockpiles & State-Level Cleanup
The U.S. has spent four decades cleaning up legacy tire stockpiles that peaked at over 1 billion tires in the 1980s. The work is 95% complete but a stubborn ~48 million tires remain in piles across a handful of states.
- Just under 48 million end-of-life tires remain in U.S. stockpiles as of the USTMA 2024 report, down from a peak of over 1 billion in the 1980s.
- 95% of the legacy 1 billion-tire stockpile has been cleaned up in the past 40 years.
- Colorado, New Jersey, New Mexico, and Texas are the U.S. states with the largest remaining ELT stockpiles, all with active cleanup programs.
- California's CalRecycle Waste Tire Cleanup (TCU) and Waste Tire Amnesty (TA) grant programs fund cleanup of illegal tire piles through state-managed contractors and grants.
- EPA Region 6 manages cross-border tire-pile cleanup along the U.S.–Mexico border in Texas and New Mexico, addressing illegal dumping.
- A 2024–2025 EPA proposal would help fund cleanup of millions of remaining abandoned tires, citing fire risk, mosquito breeding, and groundwater contamination concerns.
- Tire-pile fires are among the hardest fires to extinguish, producing toxic smoke and oily runoff that can contaminate soil and groundwater for years — the primary driver of state-level stockpile cleanup investment.
- Tire-pile stockpiles, when reduced systematically through cleanup grants and tipping-fee funding, decline at an average rate of 5–10% per year across major stockpile states.
Frequently Asked Questions
What percentage of tires are recycled in the United States?
How many tires are generated as waste each year?
What happens to recycled tires?
Are recycled tire playgrounds safe?
Why are tires considered an environmental problem if they're recycled?
What is rubber-modified asphalt (RMA)?
What is tire pyrolysis?
Related Topics
Explore related tire data:
- Tire Industry Statistics 2026: 50+ Key Stats You Need to Know — comprehensive hub of all tire industry data.
- Tire Safety & Blowout Statistics 2026 — crash data, tread depth, TPMS effectiveness, and underinflation risks.
- EV Tire Statistics 2026 — EV-specific tire wear, market growth, and OEM share — EV tires have a unique EOL profile.
- Tire Market Size & Revenue Statistics 2026 — global tire market value, growth, and forecast through 2032.
Methodology & Sources
Data on this page is compiled from authoritative public sources between 2024 and 2026 — government agencies (USTMA, NHTSA, BLS/FRED), industry associations, publicly traded tire-company annual reports, and named market-research firms. Each statistic is grouped below under the body section it supports. This page is reviewed annually; if you find a stat that has changed, please reach out.
End-of-Life Tire Volume Statistics
- Market Reports World / Smithers, 2024
- USTMA / ScienceDirect
- USTMA 16th ELT Report, October 2024
- ETRMA, 2024
- National Conference of State Legislatures tire-fee surveys
- EPA + CDC ATSDR, May 2024
- Kole et al., 2017; IUCN, 2017
- Grand View Research
U.S. Tire Recycling Rates & Trends
Tire-Derived Fuel (TDF) Statistics
- USTMA 2023 End-of-Life Tire Management Report
- Industry capacity surveys, 2024
- EPA scrap tire publications archive
- Tire Derived Fuel Market forecast, 2024
- EPA Clean Air Act Section 129
Ground Rubber & Crumb Rubber Statistics
- USTMA 16th ELT Report, October 2024
- Industry estimates / EPA scrap tire markets
- EPA / CDC Synthetic Turf Field Recycled Tire Crumb Rubber Characterization Research, 2024
- USTMA market surveys
- ETRMA materials recovery survey
- MarketsandMarkets Tire Recycling Market Report 2024–2029
Rubber-Modified Asphalt (RMA) Statistics
- USTMA 16th ELT Report, October 2024
- USTMA State of Knowledge Report on Rubber Modified Asphalt, 2024
- USTMA RMA fact sheet, October 2024
- Texas and Arizona DOT RMA performance studies
Tire Pyrolysis & Recovered Carbon Black
- Grand View Research, Tire Pyrolysis Products Market
- Recovered Carbon Black market reports, 2025
- Peer-reviewed tire-pyrolysis literature; ETRMA pyrolysis technology briefings
Global Tire Recycling Comparisons
Tire Microplastics & Environmental Impact
- Kole et al., 2017, IJERPH
- IUCN, 2017
- ScienceDirect Tire Wear Particles Systematic Review, 2024
- Tyres Europe / tire wear microplastic studies
- San Francisco Estuary Institute, via tire wear research
- Regulatory agency dockets
Tire Stockpiles & State-Level Cleanup
- USTMA 16th ELT Report, October 2024
- EPA Region 6 / state environmental agencies
- CalRecycle Five-Year Plan for the Waste Tire Recycling Management Program
- EPA News Release on abandoned tire cleanup proposal
- USTMA historical ELT data; state environmental agency reports
© 2026 SearchTires.com. This page may be cited with attribution. If you use our data in a publication, please link back to this page as the source.